
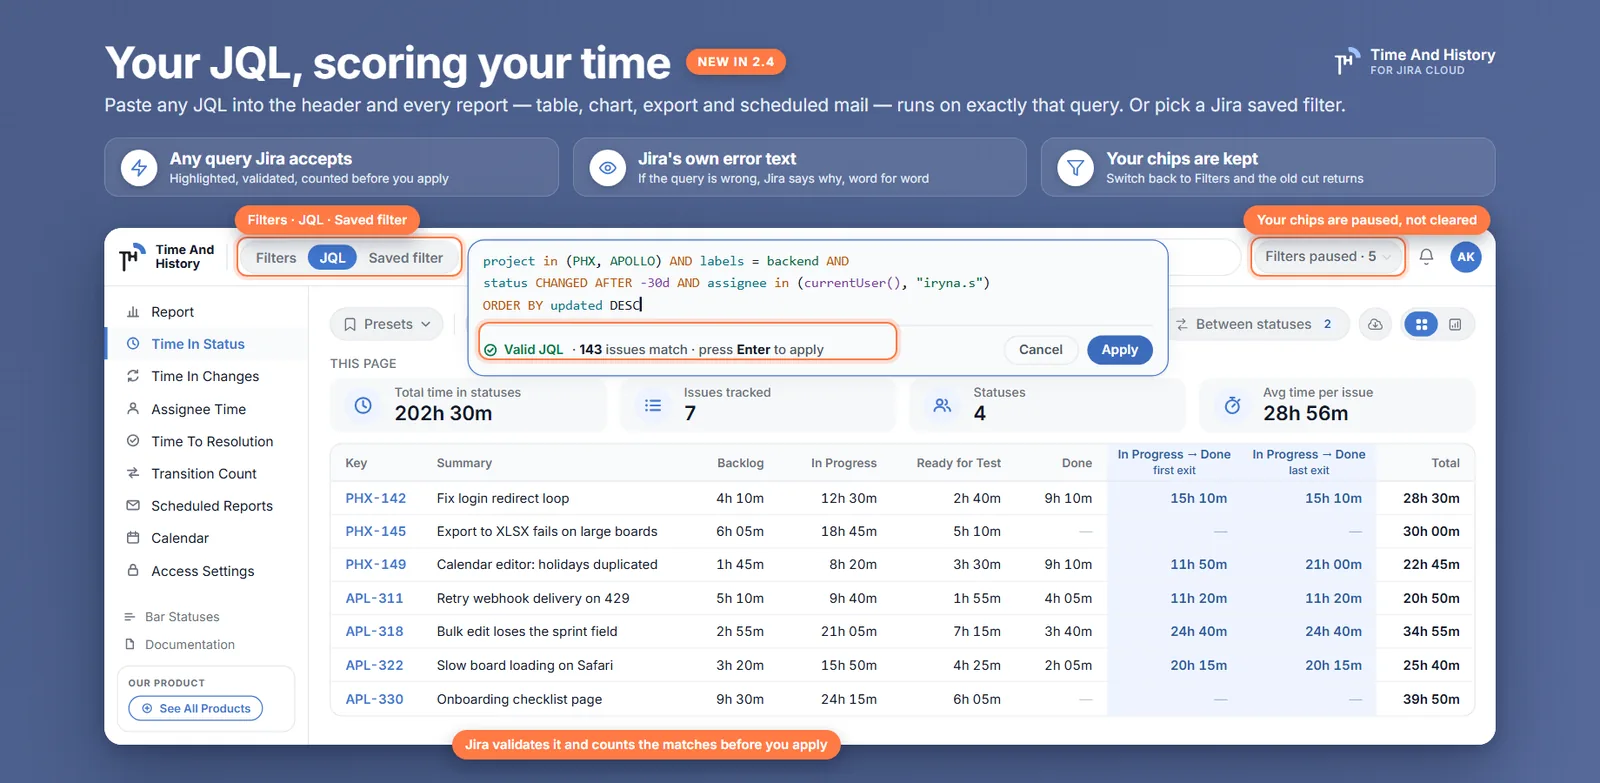
There is a moment every reporting tool runs into. Someone asks for the time in status of the payments work that shipped last quarter, excluding sub-tasks, from either of two projects, minus the three epics that were really infrastructure — and the dropdowns in front of you cannot say that sentence. Jira itself can: you already have the query, and probably a saved filter, because that is how you look at those issues every day.
Getting Jira time in status by JQL is now the same click as everything else: the report header has a Filters | JQL | Saved filter switch, and whichever one is lit decides which issues the report covers. Nothing else changes — the same table, the same charts, the same business-hours clock, the same exports and scheduled emails. This walks through both modes, the match count that tells you the query is right before you run it, and the one behaviour that surprises people: your filter chips are paused, not cleared.
Why filter chips run out before your question does
Chips are good at the questions a chip can hold. Time And History ships nine of them across the report header — project (up to ten at once), period, sprint, assignee, issue type, epic, reporter, labels and components — with the rest folded into a More filters chip whose badge counts the chips behind it and turns accented the moment one of them holds a value.
That covers most of what teams ask. It stops at three shapes of question:
- Negation. "Everything except sub-tasks", "not in these two epics", "unresolved but not blocked". A chip list is a set of things to include; there is no chip that means not.
- Or. Chips within a field are an OR, chips across fields are an AND, and that is the whole grammar. "Priority is Highest, or the label is escalation" has no expression in it.
- The filter that already exists. Your team has a board filter, a triage filter, a release filter. Rebuilding it out of chips is both work and drift: two weeks later the filter has moved and your chips have not.
JQL answers all three, and a saved filter answers the third by definition. The only thing missing was a way to hand one to a report.
How to run a Jira time in status report by JQL
- Open the report. From the Jira top bar, Apps → Time And History, then the report you want. The scope switch is in the header of all five — Time in Status, Assignee Time, Time to Resolution, Time in Changes and Transition Count — so the steps below are identical whichever one you are on.
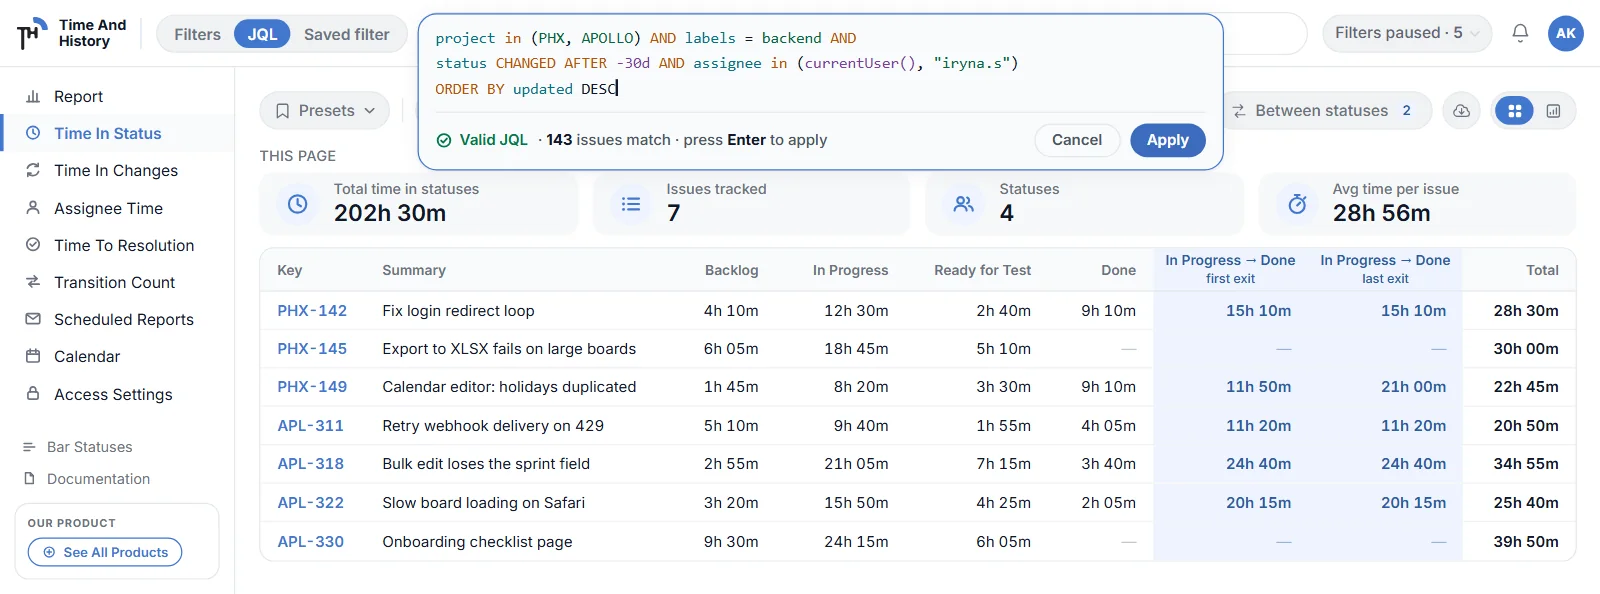
- Click JQL. The editor opens across the header. It is a real editor, not a text box: fields, keywords, values and numbers each get their own colour, so a misplaced quote is visible before you run anything.
- Paste or type the query. Up to 2 000 characters — the report scope documentation lists the other limits. Your own
ORDER BYis passed through untouched — the app never generates one of its own, so the sort you wrote is the sort you get. - Read the count before you apply. As you type, the footer settles on
✓ Valid JQL · 143 issues match · press Enter to apply. That number comes from Jira, counted as you, against the query as written — and the table shows the same rows, because the app adds nothing to the query. - Fix the query with Jira's own words. A query Jira rejects gets Jira's error, verbatim, under the editor — "Error in the JQL Query: The character '&' is a reserved JQL character…" — not a translation of it. The previous result stays on screen while you fix it, and Apply stays blocked until the query is valid.
- Apply. Every surface follows: the table, chart mode, the KPI tiles, the export and any schedule you build from here.
Time in status for a Jira filter you already have
Switch to Saved filter and you get a picker of your own Jira filters — the ones you starred, the ones you own, and the ones other people shared with you. Pick one and the report runs on it.
Three details decide whether you can trust what it returns:
- The filter is read as you. Not as the app, not as an admin. If a filter references a project you cannot see, you get what Jira would give you in the issue navigator, which is the only answer that is not misleading.
- The resolved JQL is shown, read-only, next to the chip, with its match count. You are never running a query you cannot see — useful when the filter is someone else's and has been edited since you last read it.
- A filter you lose access to is reported, not silently emptied. If it is deleted or unshared, the report says so with Jira's own message instead of quietly returning zero rows, which is the failure mode that costs a team a week before anyone notices.
The practical consequence: whoever owns the filter owns the report's scope. Edit the filter in Jira and the next run of this report follows it — which is usually the point of picking a saved filter in the first place.
"Filters paused · 5" is not a bug
Switch from chips to JQL and the chip row greys out with a badge: Filters paused · 5. It means what it says. Your five chips are held, not cleared, and switching back restores exactly the cut you had — same projects, same sprint, same assignees.
The period chip is paused with them. This trips people up, so it is worth stating plainly: in JQL and Saved filter modes there is no date range applied on top of your query. The date filtering is yours to write — created >= -90d, resolved >= startOfQuarter(), whatever you need — and nothing is added behind it. The alternative would be a report whose row count disagrees with the count you just read in the editor, and that trade is not worth making.
One honest wrinkle while you are writing dates: Jira resolves date literals inside your query against your own profile time zone, while the report's durations and chart buckets are computed against the work calendar's time zone. On a distributed team those two can differ by a working day at the boundary. If the edges matter, write absolute dates.
Sending a JQL-scoped report to people who never open the app
Both modes travel. Export the report to XLSX or CSV and the file covers every issue the query matches, not just the page you were reading — the export walkthrough covers the formats and the export history.
Scheduled reports also accept either mode, and the two behave differently on purpose:
- A JQL schedule freezes your text. The query you typed is snapshotted into the schedule, because nobody wants their Monday mailout to change meaning because they edited a report page on Friday.
- A saved-filter schedule stores the filter, not the query, and re-resolves it on every run, as the schedule owner. Edit the filter in Jira and the next email follows — which is exactly why you would choose a filter over a paste.
Two consequences worth knowing before you build one. Every run collects with the schedule owner's Jira access, so recipients see the owner's view of Jira rather than their own. And if a saved filter is deleted, the run fails with Jira's own text in the schedule's last error; it is not an access failure, so the schedule is not switched off behind your back.
Where JQL scope is the wrong tool
Four limits, because a report you have to caveat in the meeting is worse than one you understood beforehand.
- JQL picks the issues; it never computes the hours. No arrangement of operators returns a duration — that has always been true and 2.4.0 does not change it. What changed is that the query can now hand its result set to a report that does compute durations, which is how the Time in Status report reads the changelog.
- No dashboard gadget takes a query. The eight gadgets cover four of the five reports and are configured with their own filters; the scope switch is a report-page feature. A dashboard gadget plus a scheduled export is the route to people who do not open the app.
- 2 000 characters, and the chips are not additive. A query long enough to hit the cap has usually become a saved filter's job anyway. And you cannot layer a chip on top of a query to narrow it further — add the clause to the query instead.
- A wrong query is a confident wrong answer. The match count is your check: read it, and if it is not roughly the number of issues you expected, fix the query before you read a single hour. The app will faithfully compute business-hours durations for whatever set you gave it.
Jira time in status by JQL FAQ
Can JQL calculate time in status in Jira?
No — JQL returns issues, never durations. There is no operator, function or predicate that subtracts one changelog timestamp from another, and the history operators (WAS, CHANGED and their predicates) only tell you whether something happened. What you can do is use the query as the scope of a report that does the arithmetic: paste it into the JQL mode of the Time in Status report and every matching issue gets its hours per status, in business hours.
How do I run a Jira report on a saved filter?
Open the report, switch the header to Saved filter, and pick from your starred, owned and shared filters. The filter is resolved as you, its JQL is shown read-only beside the chip with a match count, and the whole report — table, charts, exports, scheduled email — runs on it. Editing the filter in Jira changes what the report covers the next time it runs.
Why did my filter chips grey out when I switched to JQL?
They are paused, not cleared. The badge reads Filters paused · N so you know how many are waiting, and switching back to Filters restores the exact cut you had. Pausing them is what keeps the editor's "143 issues match" and the table's row count in agreement — the server adds nothing to your query, including the period.
Does the date range still apply in JQL mode?
No. The period chip is paused along with the others, and no date clause is added behind your query. Write the dates you want into the JQL itself. One caveat on relative literals such as -30d: Jira resolves them in your profile time zone, while the report's durations follow the work calendar's time zone, so use absolute dates when the boundary matters.
What happens if my JQL is wrong?
The editor underlines it, blocks Apply, and prints Jira's own error message word for word under the field — the same text you would see in the issue navigator. Your previous result stays on screen while you fix it, so you never lose the report you were reading.
Does this cost anything?
Time And History is free for Jira sites with up to 10 users, with JQL mode, saved filters, exports and scheduled reports all included — there is no separate tier for them. Larger sites are on the paid plan, which starts with a free trial from the Marketplace listing. Checked 20 September 2026; the listing carries the current terms.
Paste the query you already use
The fastest way to see whether this changes anything for you: open your team's board filter in Jira, copy its JQL, and paste it into the Time in Status header. Read the match count, apply, and sort the table by the status you suspect. If the answer is interesting, save the filter and switch to Saved filter mode so the report follows it from then on.
Time in Status is one of five reports in Time And History for Jira Cloud — Assignee Time, Time to Resolution, Time in Changes and Transition Count are the others, all scoped by the same header and all counted in business hours. Install it from the Atlassian Marketplace and run last quarter's release filter through it — free for up to 10 users, so the first team can try it without a purchase order. The reports and filters documentation has the rest of the rules, and how a Time in Status report is calculated explains the numbers the query will feed. Verified 20 September 2026.