
It is Monday morning, the call is at 9:30, and the file the delivery manager asked for does not exist yet. You export the filter from Jira and the CSV comes back with a Status column that says Done and nothing about how long Done took to arrive — because time in status is not a field. So you rebuild last week's workbook: pull the changelog, pair the transitions, subtract, and hope nobody renamed a status since. That is the real Jira time in status export to Excel problem — not getting rows out of Jira, which takes one click, but getting durations into them, and then never doing it again. What follows: what the native export actually contains, and what the changelog formula route costs to keep correct. Then the file with the durations already in it — and the schedule that sends it without anyone remembering to.
Why a Jira time in status export has to leave Jira
The person who needs the answer usually has no Jira licence and no interest in acquiring one — a delivery manager assembling a board deck, a client contact checking an SLA clause, a finance analyst reconciling capitalised work. A chart on a dashboard they never open is the same as no chart at all. So the data has to leave Jira with the durations already computed, and that last clause is exactly where the native options fall short.
What Jira gives you natively
Jira Cloud has a perfectly good CSV export on issue search — Export issues from any filter, open the file in Excel, done. The catch is what the file contains: the current value of each field. The Status column says Done. How long the issue sat in In Review before that, how many times it bounced back to In Progress — none of it is in the file, because none of it is a field. Status history lives in the issue changelog, and the changelog is not part of the issue-search export.
Jira Cloud for Excel, Atlassian's official add-in, pulls issue fields straight into a workbook and refreshes them on demand, which solves the copy-paste half of the problem and none of the duration half. For the history itself the route is the REST API's changelog endpoint: one row per transition, with a timestamp, an old value and a new value. That gets you the raw material. The gap between two timestamps exists only once someone computes it, and in this route that someone is you.
The Excel formula route over the raw changelog
This route works, and for a single retrospective it is the right amount of effort. It is worth seeing in full anyway, because what it costs is not the build — it is the second month.
Suppose you have pulled the status transitions into a sheet, sorted by issue key and then by timestamp:
| Issue | Changed | From | To |
|---|---|---|---|
| PROJ-118 | 2026-08-03 09:12 | To Do | In Progress |
| PROJ-118 | 2026-08-05 14:02 | In Progress | In Review |
| PROJ-118 | 2026-08-06 10:40 | In Review | In Progress |
| PROJ-118 | 2026-08-07 16:15 | In Progress | Done |
| PROJ-124 | 2026-08-04 11:35 | To Do | In Progress |
The obvious pairing is the gap to the next row of the same issue — and this is where the first of the five problems starts. With the data in columns A through D, row 2:
=IF(A2=A3, B3-B2, IF(D2="Done", 0, NOW()-B2))
Each row's result is the time the issue spent in the status it entered on that row, so a pivot can fold the sheet into one row per issue with a column per status. For one retrospective, that is defensible. Before you commit a team to it monthly, read the next five bullets; how the same calculation is done properly is the reference to check any of it against.
The trouble starts when the sheet has to be correct rather than roughly right:
- The first interval is missing. Creation to the first transition — the time in
To Do— has no changelog row of its own. You need a synthetic row per issue built from the created date, or your backlog numbers silently collapse to zero. - Pagination. The REST API's
expand=changelogreturns at most the first 100 history entries per issue; beyond that you are paging through the changelog endpoint yourself. A two-year-old issue on an active board passes 100 entries without trying, and a sheet built on truncated history looks exactly like a sheet built on full history. - Re-entries. PROJ-118 above visited
In Progresstwice. The arithmetic adds up either way, but every downstream reader of the sheet has to remember that one cell may hide three visits — and the number of visits is nowhere in the sheet unless you build a second one to count them. - Business hours.
B3-B2counts weekends and nights. Subtracting them — per weekday schedule, per time zone, minus public holidays — turns a helper column into a project; what a work calendar changes in your numbers is the shape of the thing you would be reimplementing. Most sheets quietly skip this step, and then the numbers get compared against a team's working-hours intuition anyway. - It rots. The workbook is correct on the day you build it. Someone renames a status in the workflow, and the formulas stop matching their headers; nobody notices until the numbers look odd in a review.
None of this is an argument against the approach for a one-off. It is an argument against maintaining it monthly.
How to export Jira Time in Status to Excel, step by step
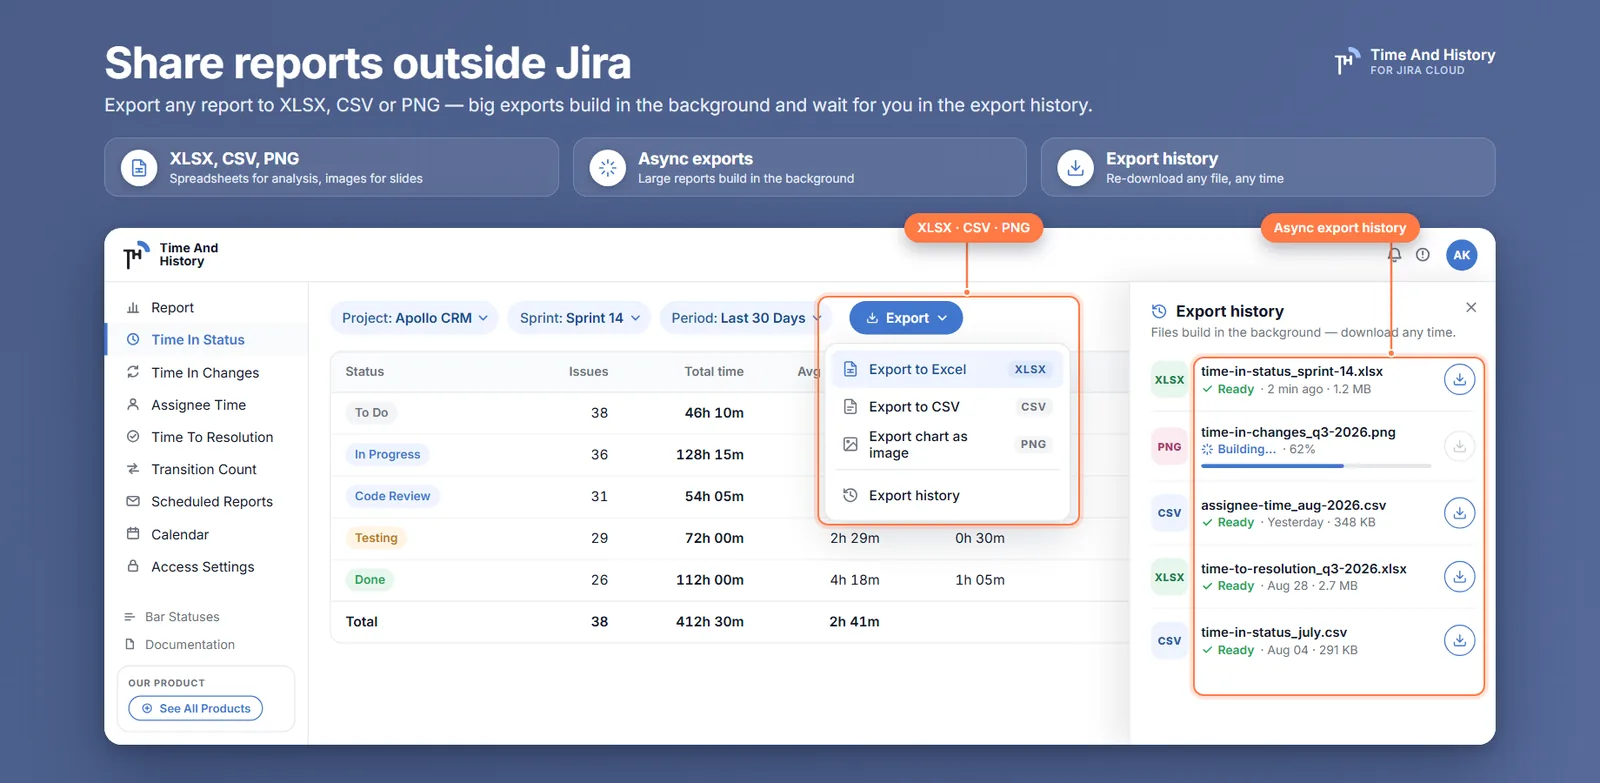
The procedure below takes about two minutes, and the file it produces is the workbook you were building by hand — one row per issue, one column per status, with the first interval, the re-entries and the full changelog pagination already handled, on your work calendar. Time And History computes the durations before the export, so the file that leaves Jira already contains the answer, and the Time in Status report is where you start.
- Open the report and narrow the filter. Pick the project, then optionally epics, sprints, reporters, assignees, and a date preset over created, updated or resolved dates. The filter defines the export exactly — what matches the filter goes into the file.
- Set the work calendar before you export. Business days, per-day hours, holidays and time zone: every duration in the file is counted against the work calendar that was selected when the job ran, and what a calendar changes in your numbers has the mechanics. The time format next to it is a screen setting only — the file writes
1h 43mwhichever format the report is showing. - Add the columns you want on screen. The Columns selector searches every Jira field, system and custom — labels, priority, a "Customer" field of your own. It shapes the report page, not the file: the export's identifying columns are fixed at
Issue Key,Issue Type,SummaryandAssignee, so a recipient who needs a Jira field beyond those still needs a lookup export from Jira's own issue search beside it. - Press the export button in the controls row and choose the format:
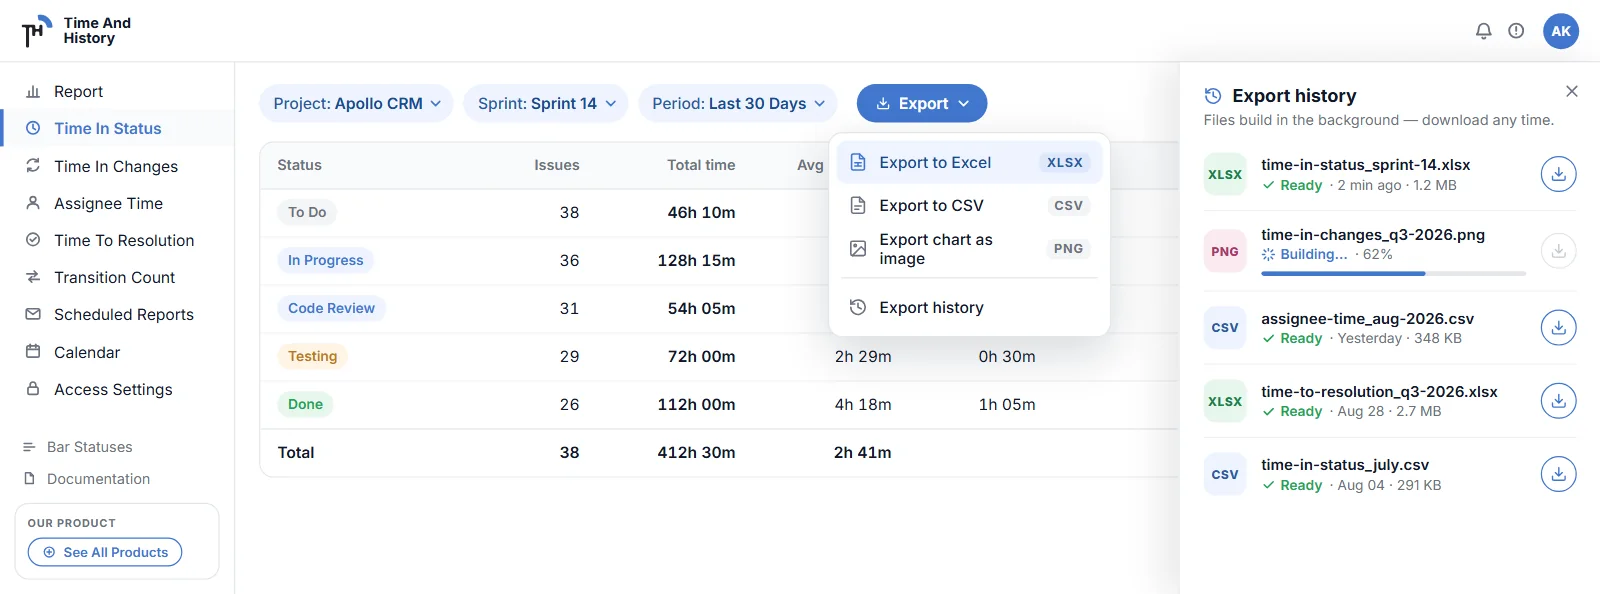
MS Excel Report (.XLSX),Plain Text Report (.CSV), orChart Image (.PNG)while chart mode is open. Since 2.3.0 all five reports have chart mode, so the PNG is offered on all five. - Let the job run. The export runs in the background over every issue matching the filter — not the visible page — with a progress bar in the Export history panel. The job replays your filter page by page and reads each issue's changelog, so the wait scales with the issue count rather than the date range; you can change filters or leave the page meanwhile.
- Download from Export history. The panel keeps your twenty most recent exports with their status — In Queue, In Progress, Success, Failed — for re-download or deletion. Files are private to whoever created them.
None of this costs anything on a site of ten Jira users or fewer, which is enough for one team to settle whether the columns are the ones their audience asks about before anyone raises a purchase order.
Get the Jira report emailed every Monday: scheduled reports
An export is a snapshot of a filter at the moment the job ran — fine, until the snapshot has to be taken every Monday before that 9:30 call, because a recurring task on a person is how reporting quietly stops happening.
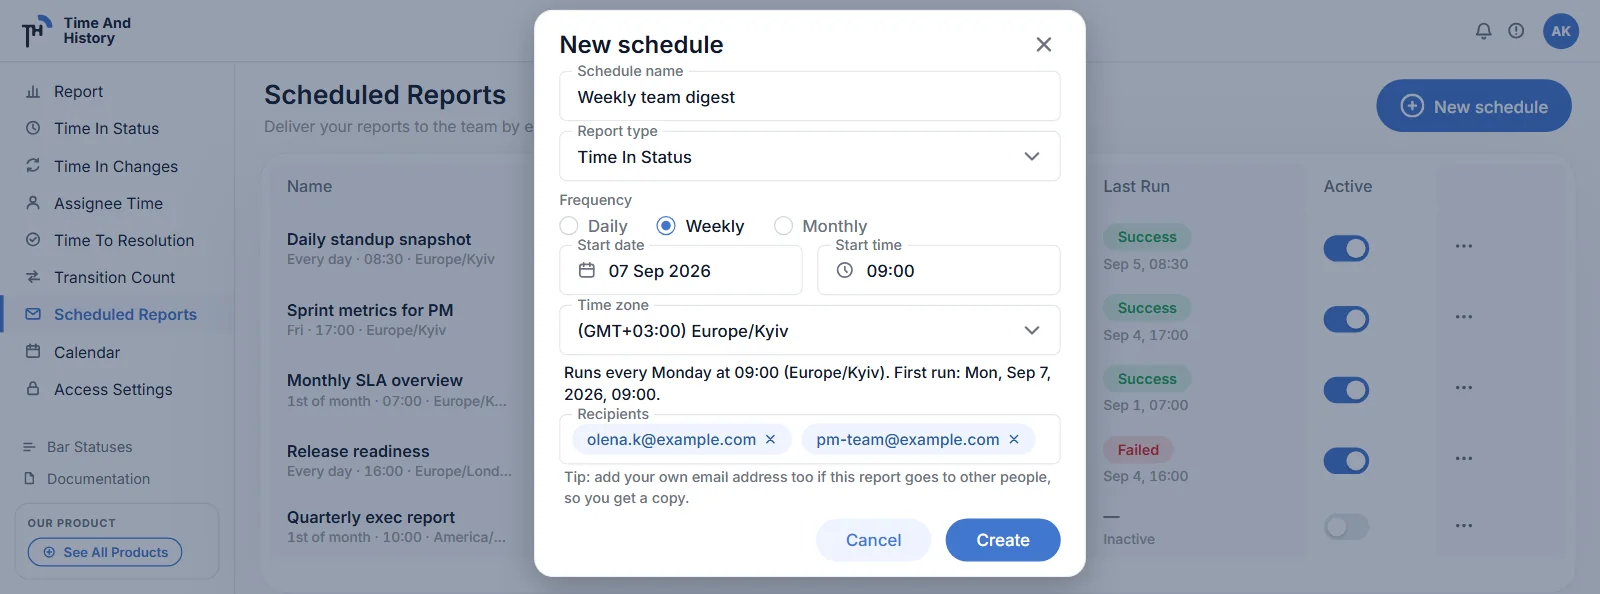
Since 2.3.0 the app takes it instead. Set the filters on the report page, open Scheduled Reports and create a schedule — and note the order: the filters have to exist on the page first, because the schedule takes a snapshot of them at creation. Once it exists, nobody owns it. There is no automation rule to keep green, no custom field to protect and nobody to hand the task to before you go on leave — the file arrives whether or not anyone remembers it should.
What a schedule holds:
- Any of the five reports, with the filters and the work calendar frozen as you set them. Editing a schedule later changes its name, its report, its frequency, its time and its recipients — never its selection. A different filter or a different calendar is a new schedule, which is the real reason to get the filter right before you press Create.
- Daily, weekly or monthly, from a start date and a start time in a time zone you pick, so "every Monday at 09:00" means 09:00 where the readers are, not where the server is.
- Up to ten recipients, typed in by whoever creates the schedule. Nobody is subscribed implicitly, and no Jira group is expanded into a mailing list — if you want the file yourself, add your own address.
- The XLSX attached to the mail, when the file is 7 MiB or smaller. Above that the mail arrives without the attachment and says the owner can download it from Export history instead. A schedule always sends XLSX; CSV stays a manual export.
- Every run listed in Export history, in the same twenty-file panel as your hand-started exports. Twenty is worth knowing: a daily schedule fills every slot in under three weeks, which is about when a hand-started export you suddenly want back has already gone. The panel does not badge scheduled runs, but the file name does — a scheduled file is stamped
Scheduledwhere a manual one saysFilterorChart.
One property to carry into the recipient list: a scheduled run collects as the schedule owner, so a schedule is worth creating from an account whose Jira permissions match what the audience is allowed to see.
What lands in the file: the XLSX sheets and the CSV
What lands in the file decides whether the recipient comes back with a follow-up question or just uses it. The XLSX is a real workbook, not a CSV with an .xlsx extension. The Issues sheet is one row per issue: Issue Key, Issue Type, Summary, Assignee, one column per workflow status found in the filtered issues, Total, then a <status> (entries) column counting how many times each issue entered that status, then any Between Statuses pair columns. Both of those blocks are appended after Total rather than interleaved with the durations, so a pivot or a template built on last month's file still points at the same columns.
| Issue Key | Issue Type | Summary | Assignee | To Do | In Progress | In Review | Total | To Do (entries) | In Progress (entries) | In Review (entries) |
|---|---|---|---|---|---|---|---|---|---|---|
| PROJ-118 | Bug | Payment webhook retries duplicate charges | M. Keller | 2h 50m | 16h 20m | 25h 10m | 44h 20m | 1 | 2 | 2 |
| PROJ-124 | Story | Bulk-edit for saved filters | A. Osei | 6h 40m | 11h 5m | 3h 30m | 21h 15m | 1 | 1 | 1 |
| PROJ-131 | Task | Rotate staging TLS certificates | R. Lindqvist | 12h 15m | 4h 0m | 16h 15m | 1 | 1 |
A status the issue never entered is a blank cell in the file — the dash you see on screen is the report's convention, not the workbook's — and a blank is not a zero, which is the property that keeps a journey that never happened out of an AVERAGE. The status columns come from the data, not from configuration: filter a project with a Waiting on Customer status and the column appears on its own. The entries columns are counts rather than durations, and they are exactly the re-entry number the formula route above cannot produce without a second sheet.
Any Between Statuses pairs you picked come with it. Add In Progress → Done on the report and the file gains a column headed In Progress → Done (first exit) — the working time between the two statuses, per issue, in both XLSX and CSV. What that number counts, and why the same pair reads differently on a reopened issue, is the time between two statuses.
Time in Status, Assignee Time and Time to Resolution always add a Chart Data sheet: one row per series with the total as text, the same total in seconds, and its share of the whole, largest first, ending in a Total row. Transition Count gets a Totals sheet in its place, because its Issues sheet carries no totals row. Exported from chart mode, the workbook also carries the chart images — for the reader who will never open Jira.
| Status | Total Time | Total Seconds | Percentage Of Total Time |
|---|---|---|---|
| Blocked | 627h 45m | 2259900 | 36.25 |
| In Progress | 498h 15m | 1793700 | 28.78 |
| In Review | 391h 0m | 1407600 | 22.58 |
| To Do | 214h 30m | 772200 | 12.39 |
| Total | 1731h 30m | 6233400 | 100 |
Total Seconds is the column to point a formula at; every other duration in the workbook is text.
The CSV is the same issues table as plain text with a UTF-8 byte-order mark, so Excel opens it with the arrows and accented names intact instead of mojibake — the right choice when the destination is a script, a BI pipeline or a data warehouse rather than a human. It carries the table and nothing else; the extra sheets are an XLSX feature. The PNG is a snapshot of the open chart, for the reader who needs one picture and no table at all.
All five reports export, not only Time in Status — Assignee Time, Time to Resolution, Time in Changes and Transition Count use the same button, the same background job and the same history panel. The exporting documentation is the authoritative list of formats and sheet contents.
Five questions to ask any export before you standardise on it
- Does the file cover the filter or the page? Here the export is a background job over every issue the filter matches; the table on screen is a fifteen-row window onto the same result set.
- Do the columns that carry the judgement travel into the file? Between Statuses pairs arrive in both XLSX and CSV with the loop rule inside the header cell —
In Progress → Done (first exit)— so the rule travels with the number instead of living in someone's memory. - Is there a record of what was sent? Export history keeps your twenty most recent files, manual and scheduled alike, with the state of each run.
- Does the workbook carry more than rows? Time in Status, Assignee Time and Time to Resolution add a chart-data sheet of totals and percentages; Transition Count adds a totals sheet; exports taken from chart mode carry the chart images.
- Whose Jira is in the file? On the report page every read runs as the person looking at the screen. A scheduled run collects as the schedule owner. Knowing which one produced a file is the difference between a report and a permissions incident.
Export Jira status history to Excel free
The DIY route stays a fair answer for a genuinely one-off need — a single retrospective, one issue's history, an audit question about who changed what and when. For that last case the changelog itself is what you want rather than a duration, and Time in Changes reads it as a report: who changed the status, when, from what to what, and how long the old value lasted.
For everything recurring, the arithmetic belongs in the tool and the judgement in the spreadsheet. If your site has ten Jira users or fewer, Time And History is free — which makes "export Jira status history to Excel free" a solved problem rather than a search query: install, open Time in Status, filter, export. Above ten users there is a trial to establish whether the report answers your questions before anyone signs anything. Pricing is the most perishable fact on this page; it was verified on 6 September 2026 and the listing is the authority.
Jira time in status export to Excel FAQ
Can Jira export time in status to Excel natively?
No. The native issue-search CSV export carries each field's current value, and time in status is not a field — it is a calculation over the issue changelog, which the export does not include. Jira Cloud for Excel can pull issue fields into a workbook, but the duration arithmetic over the changelog is yours to build.
How do I export Jira status history to Excel for free?
For ten or fewer Jira users, Time And History is free: open the Time in Status report, filter, and export XLSX or CSV. Without an app, pull changelog rows via the REST API and compute the gaps with formulas — workable for one-offs, fragile as a recurring process.
Does the export include all issues or only the visible page?
All of them. The export runs as a background job over every issue matching the current filter, with progress shown in the Export history panel — the table in front of you is a fifteen-row window by default onto the same result set.
Someone questioned the numbers in the file. What do I show them?
Open the report with the same filter and the same work calendar. The file is that computation over every issue the filter matched, so the rows on screen are the file's own working. The footer under the table — Avg, Median, Min and Max — covers the page in front of you and says so, which means anyone who doubts it can recompute it from the rows they can see. Durations are floored, never rounded up, and a status an issue never entered is left blank rather than zeroed, so nothing in the file is inflated by a journey that never happened. If the challenge is about the clock, name the work calendar: business days, per-day hours, time zone and holidays are what turned wall-clock time into the numbers in the cells. What the mean hides in a Jira average is the other half of that conversation.
Should I export XLSX or CSV?
XLSX when a person will read the file: it carries the Issues sheet, the chart data with totals and percentages, and the chart images when exported from chart mode. CSV when a machine will read it — one issues table, UTF-8 with a byte-order mark so Excel still opens it correctly, ready for scripts and pipelines. Scheduled reports always send XLSX.
Can Jira email a time in status report on a schedule?
Yes, since version 2.3.0. Set the filters on a report page, then create a schedule: any of the five reports, daily, weekly or monthly, at the start date, time and time zone you choose, mailed as an XLSX to up to ten recipients you type yourself. The filters and the work calendar are frozen at creation — editing a schedule changes its name, report, frequency, time and recipients, not its selection — and every run appears in Export history. The run collects as the schedule owner, so recipients see the owner's view of Jira.
Do the exported durations respect business hours?
Yes. Durations are counted against the work calendar selected when the export runs — weekday hours, holidays and time zone — so the file agrees with the report it came from. The on-screen time format does not travel with it: the file writes 1h 43m regardless of which format the report was showing. What a work calendar changes in your numbers has the mechanics.
Export it once, then stop exporting it
Open Time in Status on the sprint that just closed, set the work calendar, press Export, and open the XLSX: about two minutes, and it tells you whether the columns are the ones your audience asks about. Then turn that exact filter into a schedule and take Monday morning off your calendar for good.
Time And History for Jira Cloud is five reports built from Jira's issue history — Time in Status, Assignee Time, Time to Resolution and Time in Changes in business hours, plus Transition Count, which counts status changes rather than hours — each exporting to XLSX and CSV, and each able to arrive by email on a clock. For readers who will not open a file either, all five also go on a Jira dashboard as gadgets. Install it from the Atlassian Marketplace and export last sprint's Time in Status — free for up to 10 users, so the first team can try it without a purchase order. The scheduled reports documentation has the rest of the rules. Verified 6 September 2026; gadget coverage updated 26 September 2026.