
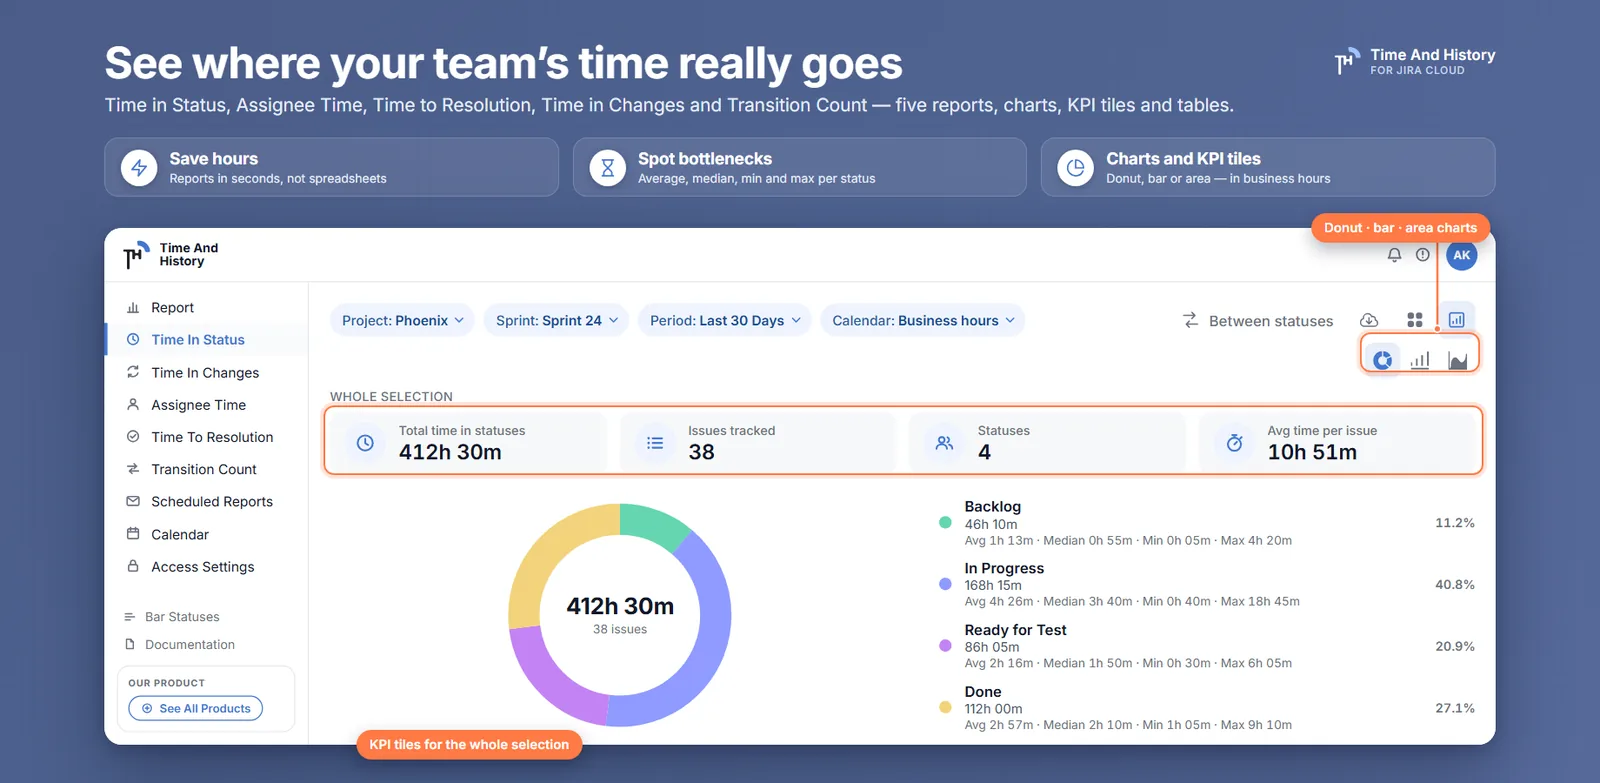
Someone in the retro says review is where everything gets stuck, and the only evidence in the room is that it feels that way. A Jira time in status report is how that becomes a number: how long every issue sat in To Do, In Progress, In Review and Blocked, in business hours, per issue, on your calendar. Jira Cloud does not store those durations — it stores the moments the status changed — so every report of this kind is something computing the gaps, and three decisions inside that computation are why two tools can read the same project and disagree. The short answer: sort the status changes, pair each with the next, attribute the gap to the status the issue was in, and measure it against a work calendar. Most teams open the report to find out how long the work took and find out how long it waited instead.
What Jira actually stores: transitions, not time in status — and why two tools disagree
Open the History tab on any issue and count the rows: one per change, each carrying when it happened, which field moved, and from what to what. No row holds a duration, because no duration was ever computed. The number you want is the distance between two rows, and it exists only after something measures it.
That is where two reports of the same project part company. Both can be right, because each made its own decisions about the gaps: what to do with the stretch before the first transition, how to treat an issue that is still open, and whether a weekend counts.
The History tab is not always complete, either. Atlassian documents cases where it omits a field — sometimes only the rendering is missing, sometimes the record itself is gone.
How a Jira time in status report is calculated — and the three decisions inside every number
The mechanical part is straightforward. Sort the status changes by time, pair each one with the next, and attribute the interval to the status the issue was in. The last interval always runs to the moment the report is generated, whatever status the issue is sitting in — so a resolved issue's Done column keeps growing after it is closed, and the same filter run tomorrow will not return today's number. Nothing is silently dropped, which is the point, but it has to be read that way. Sum by status and you have a row per issue:
| Key | To Do | In Progress | In Review | Blocked | Total Time From Create Issue |
|---|---|---|---|---|---|
| PROJ-118 | 2h 50m | 16h 20m | 25h 10m | 49h 45m | 94h 05m |
| PROJ-124 | 6h 40m | 11h 05m | 3h 30m | - | 21h 15m |
Columns appear on their own — one per workflow status found in the issues on the page in front of you, no configuration — so turning a page or widening the filter can bring a new column with it. A status an issue never visited shows - rather than a zero, so an empty cell never reads as "fast".
The judgement calls sit around that loop:
- Issues that re-enter a status. A single per-status total hides the shape: three short trips through In Review is a different story from one long one. The totals live in Time in Status; the individual visits live in Time in Changes, which lists every transition with the working time the previous value lasted.
- Statuses removed from the workflow after the fact. The history still references them, so the report has to.
- Issues moved between projects, where the workflow itself changed mid-life.
Underneath all three sits the choice of clock: turning timestamps into working time takes a calendar, and that choice is settled in step 4 below.
How to build a time in status report in Jira Cloud, step by step
Six steps, about a minute, and step four moves the numbers more than the other five combined. The report page in Time And History for Jira Cloud is a filter bar over that table and its charts:
- Open the report. From the Jira top bar, Apps → Time And History, then Time in Status.
- Choose the Project, then narrow with Epic or Sprint. Both are multi-select, and an empty filter means any. Changing the project reloads its epics and sprints and resets the dependent filters, which lets one report answer a per-sprint retro and a per-epic question. Reporter and Assignee narrow it further.
- Set the date range. Pick the date it applies to — Created, Updated or Resolved — then a preset or custom range. This decides which issues are in the report, not which part of their history counts: an issue matched on Created still shows its full per-status totals.
- Pick the work calendar. The calendar selector decides which business days, work hours, time zone and holidays every duration is measured against, and it moves the numbers more than any other filter on the bar. An issue that enters Blocked at 16:00 on Friday and leaves at 10:00 on Tuesday is 90 hours of wall-clock time and 10 on a Monday-to-Friday, 09:00–17:00 calendar. The queue statuses lose the most, because the nights and weekends were hiding there. A calendar is not attached to a project; it is yours. Pick it once and Time And History keeps it across sessions, browsers and devices, on every report and gadget you open, without changing anyone else's numbers — see what work calendars change in your numbers.
- Choose the view. Table gives one row per issue with a column per status. Chart gives a donut, bar or area chart; for the bar and area charts a metrics period dropdown — auto through year — sets the buckets. Columns and Time format apply to both. The four formats —
HM, Decimal Hours,DHM, Decimal Days — change the unit only, never the calendar-aware working time underneath. In the two day-based ones a "day" means 24 counted working hours, not one business day; what DHM and Decimal Days actually mean works an example through, and the report filters list every field. - Read the tiles, then the footer. Four KPI tiles sit above the table — Total time in statuses, Issues tracked, Statuses, Avg time per issue — under the caption This page. Avg, Median, Min and Max run under every status column and the total, over those same rows: the footer covers the issues on the page you are looking at — fifteen rows by default — not the whole filter, and it names that page, which is what lets anyone who doubts the average add up the column in front of them and get the same answer. Switch to chart mode and the same four tiles recompute over every issue the filter matches, with the caption changing to Whole selection to say so.
Nothing in that list is a thing to keep running. The status columns are not configured — one per workflow status the issues in front of you actually visited, appearing and disappearing as the workflow does. There is no rule to switch on, no custom field to protect and nobody to hand it to when you go on leave. The calendar you pick is remembered for you across sessions, browsers and devices, and the next person to open the report picks their own without changing yours. The maintenance cost is all in the table further down: an Automation rule is a rule somebody owns, and it is wrong the morning after the workflow changes.
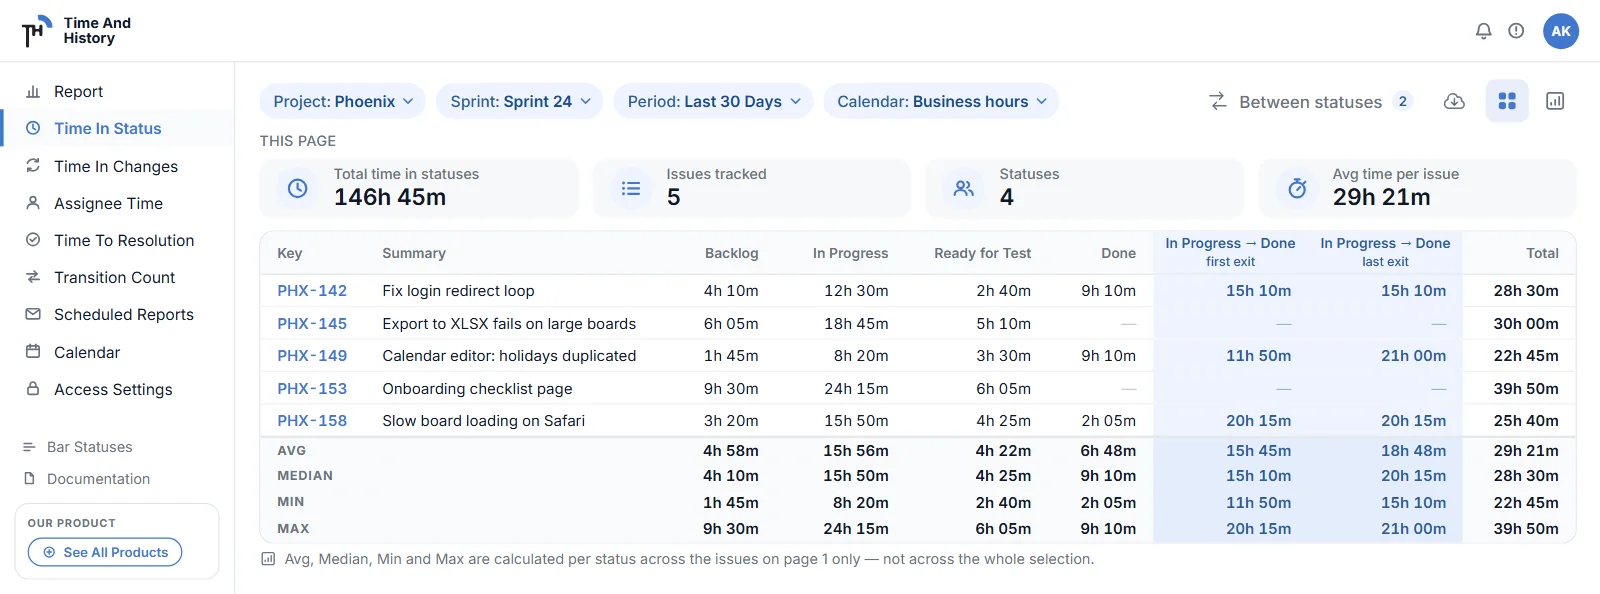
One caution when you switch to the donut, bar and area charts: like the tiles above them, they aggregate over every issue matching your filter rather than the page you were reading — which is what you want for a share-of-time question, and why the totals under a chart will not match the table you just left.
How to read a time in status report: waiting statuses and the real bottleneck
In Progress is usually the smaller half of a cycle; the queue statuses around it — ready for review, blocked, waiting on customer, ready for release — are where the calendar time goes.
That is a useful result, because waiting is the part a team can usually change without working harder. Reviewing in the morning rather than at the end of the day moves a number that no amount of effort inside In Progress would have moved.
One habit keeps the reading honest: read Median alongside Avg. A single issue stuck in Blocked over a shutdown can double the average of the fifteen rows in front of you, and if the median barely moves, the bottleneck is that one ticket rather than the queue — what the mean hides in a Jira average works the distribution through in full.
Then change the slice rather than the metric. Per sprint, the question becomes is this getting worse: a review column growing sprint over sprint is a staffing signal, one that spiked once is an incident. Per epic, it becomes which work is expensive.
If the question turns out to be about people, workload per assignee puts one row per issue and one column per assignee, plus Unassigned and Total Time From Create Issue. If it is end to end, Jira time to resolution measures created-to-done on the same clock, with Done 1st, 2nd and 3rd columns for reopened issues. And if it is the span between two named statuses — how long from In Progress to Done — the time between two statuses adds that as a column on this same table, with a choice about which entry into Done ends the interval.
Four questions to ask any time in status report
Every app in this category will show you hours per status. The hours are not the product; being able to quote them without getting unpicked is. Before you standardise on one, open it and check:
- Does every number say which issues it covers? Here the footer covers the page it names, and the KPI tiles above the table are captioned This page. Switch to chart mode and the same tiles recompute over the Whole selection — every issue the filter matches — and the caption changes to say so. A summary that will not name its own scope cannot be checked.
- Can you recompute the summary from the rows in front of you? Fifteen rows on screen and a footer computed over those fifteen rows means anyone who doubts the average can add up the column. That is the whole defence, and it is not available if the summary is computed somewhere you cannot see.
- Does a status the issue never visited show a dash or a zero? A zero claims the issue went through instantly and drags the average down; a dash says it did not happen.
- Which way does it round? Durations here are floored, never rounded up, so the report never claims more time than the changelog can support.
Does Jira have a built-in time in status report? How far each native option gets
Jira has several surfaces that circle this question, each answering something real. Sort them by ceiling: some give no durations at all — the History tab, Days in column dots, WIP limits — some give durations but only aggregated, one gives per-issue durations going forward. All count calendar time, with two exceptions: Automation's businessDays unit, which counts whole Monday-to-Friday days with no notion of hours or holidays, and Jira Service Management SLAs, which honour working-hours calendars in service projects only.
| Native option | Answers well | Where it stops |
|---|---|---|
| Control Chart | Cycle and lead time trend for chosen columns, with an average and a deviation band | Atlassian's page has no concept of weekends, working hours or holidays. Board-scoped, and the chart is the deliverable: no per-issue table to export |
| Cumulative Flow Diagram | Where work is piling up: a widening band marks the bottleneck column | Counts, never durations. You see In Review swelling, not how long a ticket sat there |
| Average Time in Status gadget, among Jira Cloud's built-in gadgets | A per-status average charted over time — "displays the average number of days work items have spent in status" | An average with nothing underneath: no per-issue rows, in days. Per Atlassian's suggestion tracker (JRACLOUD-77733) and consistent community reports its scope is resolved work items, so a growing Blocked queue stays invisible |
JQL's history operators (WAS, CHANGED) | Which issues, precisely, about the past — everything ever blocked last month | Set membership, never arithmetic: a query returns issues, not durations. The famous near-miss, status = "In Review" AND NOT status CHANGED AFTER -5d, is a threshold test |
| Jira Automation (stamp on entry, accumulate on exit) | The only stock Jira feature that computes and stores a duration, as a field you can filter and export | It cannot see the past — only transitions after you switch it on. Automation's date smart values have no businessHours unit, and businessDays counts whole Monday-to-Friday days |
| The changelog endpoint | Everything, for all of history — pairing consecutive entries gives exact per-status durations, however old the work | You own the computation: mandatory pagination, one-plus request per issue, working hours and holidays to implement yourself. A script run, not a report |
| Atlassian Analytics' Time-in-status history template | Genuinely the question, at scale: time in current and past statuses, by status, work type and assignee | Gated by plan, not effort — the Data Lake and Analytics are Cloud Enterprise features. Anything the template misses means SQL against the lake |
Only two clear every ceiling, and both charge for it in something other than money. Atlassian Analytics is a Cloud Enterprise entitlement — a plan decision rather than a reporting one, and not one most teams can make this quarter. The changelog endpoint is free and complete, and its price is that somebody now owns pagination, a request per issue, a working-hours implementation and the argument about whether the output is right. Both are projects with an owner. The reason to run this as a report instead is not accuracy — it is the same changelog underneath — it is that the report exists before the meeting rather than after it: last sprint is on screen in about a minute, against a calendar you picked, with nothing left running for anyone to maintain.
There is a fourth route nobody lists because it is not a feature: export the raw history, or last month's per-issue times, and do the arithmetic in a spreadsheet. Asked once, that is a legitimate answer — the spreadsheet route, done properly walks it through, including the formulas. It stops being one the second time it is asked. The file is stale the moment it is downloaded, the working-hours arithmetic is yours to defend in the meeting where it is doubted, and next quarter somebody repeats the exercise slightly differently and produces a number that disagrees with yours for reasons nobody can reconstruct.
If the sprint that closed last week is the one being argued about, that report is about a minute away — pick the project, pick the sprint, pick a calendar, read the footer. Time And History is free for Jira sites with up to 10 users, so the first team can find out whether the number changes the conversation before anyone raises a purchase order.
Getting the report to the people without a Jira licence
The person who needs the answer often has no Jira licence and no interest in acquiring one, and a chart on a dashboard they never open is the same as no chart at all.
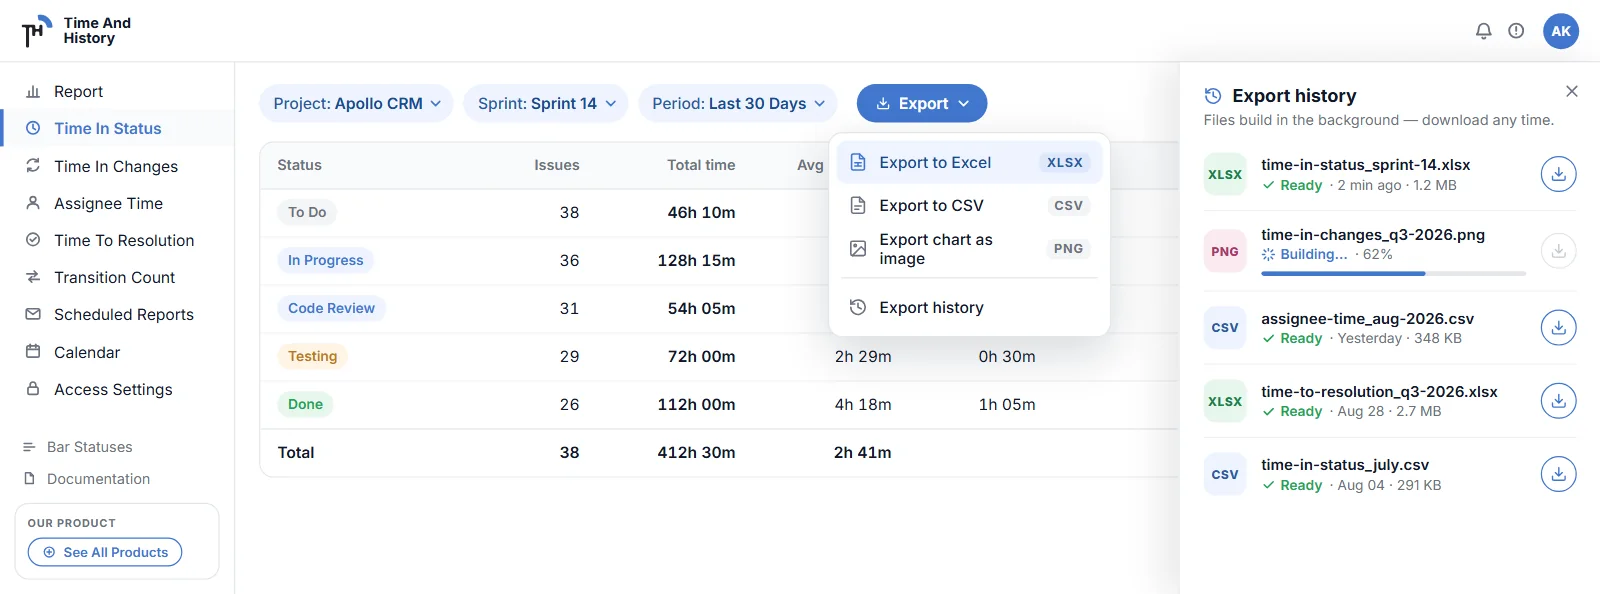
So the report has to leave Jira cleanly, in four beats. Set the filters first — the export takes them as they stand. Open the Export menu and pick MS Excel Report (.XLSX), Plain Text Report (.CSV) or Chart Image (.PNG). The file is built in the background over every issue matching the filter, not the visible page. Then download it from Export history, which keeps your twenty most recent files, private to their creator and deletable. XLSX and CSV are offered on all five reports, and since version 2.3.0 the PNG button appears on any of them while chart mode is open — see Exporting Time in Status to Excel, CSV or PNG, and the Jira time in status export to Excel walkthrough for the native CSV, the changelog formula route and the weekly schedule.
And when the answer should arrive whether or not anyone opens anything, a scheduled report delivers it: daily, weekly or monthly, at a start time and time zone you choose, with the filters frozen exactly as you set them, as an XLSX attached for up to ten recipients you type yourself. Every run appears in Export history alongside your manual files, against the same twenty-file limit. A scheduled run collects as the schedule owner, so recipients see the owner's view of Jira.
Since version 2.2.0 the report also exists as a chart gadget and a table gadget, so if the answer should be visible before anyone asks, put a Time in Status gadget on a Jira dashboard.
Jira time in status report FAQ
How is time in status calculated in Jira?
It is not — Jira stores each status change as a changelog entry, and any duration is computed afterwards by sorting those entries, pairing each with the next, and attributing the gap to the status the issue was in. Three decisions settle whether two tools agree: what happens to the interval from creation to the first transition, whether an open issue's interval runs to now, and which calendar the gaps are measured against.
Does Jira have a built-in time in status report?
No report page. Three native surfaces measure durations — the Control Chart, the Average Time in Status gadget and, on Cloud Enterprise, the Atlassian Analytics time-in-status template — while the Cumulative Flow Diagram charts counts, not time; none gives per-issue durations in working hours over an arbitrary filter, and the table above says where each one stops.
How do I see the average time in status per status?
In Time And History, read the four KPI tiles above the Time in Status table and the Avg, Median, Min and Max row in its footer, for every status column and the total. Both cover the issues on the current page — fifteen by default, and the caption and the footer each name it — while chart mode and the exports cover every issue the filter matches. The full reading is what the mean hides in a Jira average.
Can a Jira time in status report exclude weekends and holidays?
Yes, if the durations are computed against a work calendar — business days, work hours, a time zone and recurring holidays; the full answer is Jira time in status excluding weekends. Native options count calendar time, with two exceptions: Automation's businessDays unit, which counts whole Monday-to-Friday days, and Jira Service Management SLA calendars, which exist only in service projects.
Can I export a Jira time in status report to Excel?
Yes — XLSX and CSV on every report, plus a PNG of the open chart from chart mode, each built in the background over every issue matching the filter rather than the visible page and delivered through Export history. The export walkthrough has the mechanics, including what the workbook contains and how to put the same file on a weekly schedule.
Find the status your work is actually waiting in
Start narrow. Pick one project and one sprint, set the work calendar, and read the footer. If a queue status is the largest number on that row, you have found the thing worth changing this month.
Time in Status is one of five reports in Time And History for Jira Cloud, alongside Assignee Time, Time to Resolution and Time in Changes — all counted in business hours — and Transition Count, which counts status changes rather than hours. Install it from the Atlassian Marketplace and run it on the sprint that closed last week — free for up to 10 users, so the first team finds its slowest queue without a purchase order. The Time in Status documentation has the rest of the rules. Verified 6 September 2026.