Jira Time in Status reports: average time per status, on the issue view and by email
Time And History is a Jira Time in Status app that turns issue history into five reports — Time in Status, Assignee Time, Time to Resolution, Time in Changes and Transition Count. Read them on the report page, on the Jira issue view, in dashboard gadgets or by email, and pick the issues with filter chips, raw JQL or one of your Jira saved filters.
Where does the time go? Time in Status shows the status where issues wait longest, Assignee Time shows who held them and for how long, Time to Resolution shows created-to-done with reopens counted, Time in Changes shows who changed what, and Transition Count shows how often issues went back — every number in business hours. Pick the issues with the filter chips in the header, with raw JQL or with a Jira saved filter; read the same five reports on a ticket, and have any of them arrive by email on a schedule. Free for up to 10 users.
Time in Status report
Time in Status for Jira Cloud: how long issues sit in each status
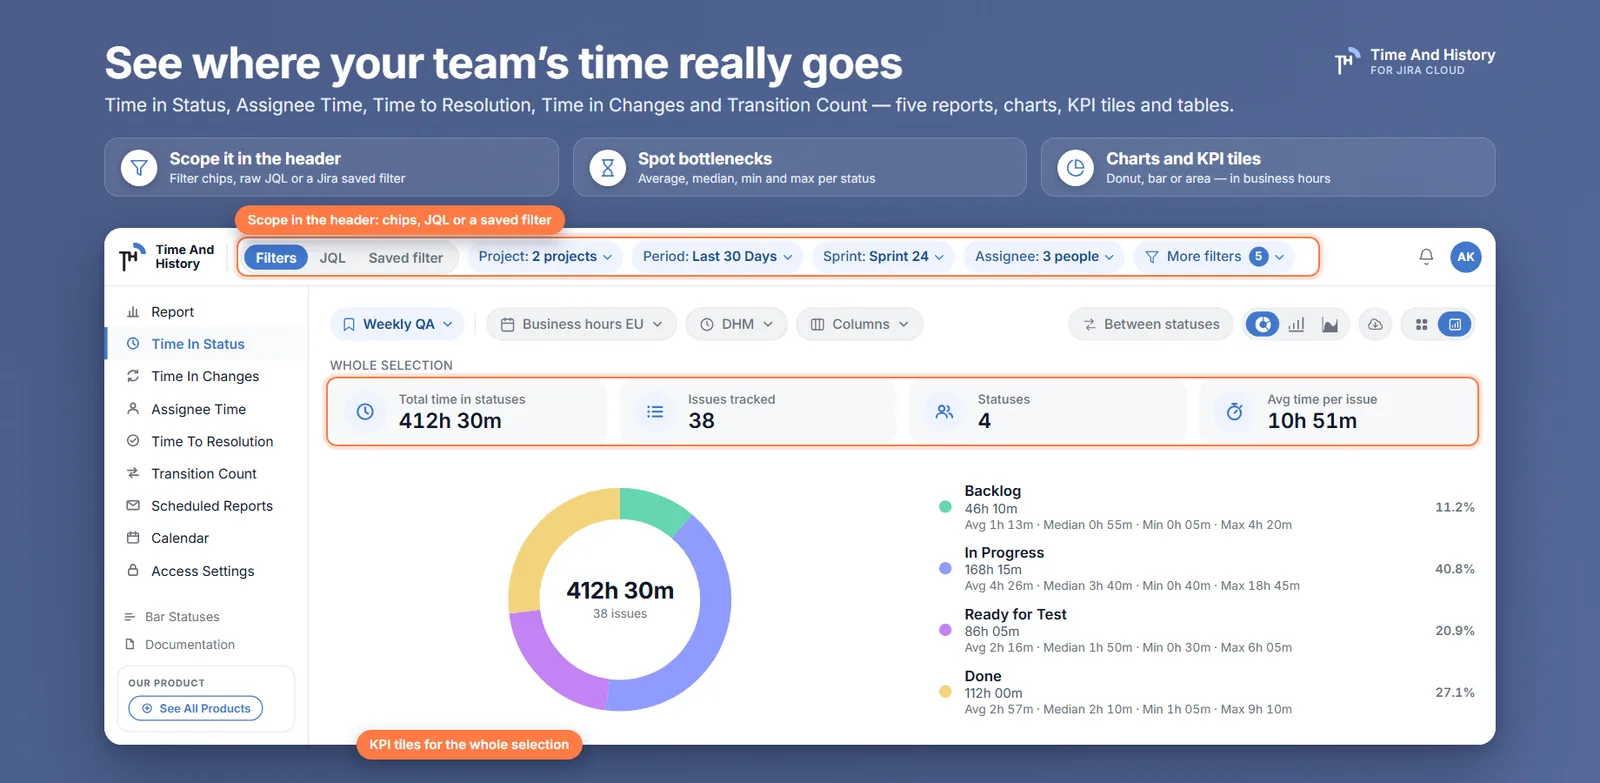
The Time in Status report answers “how long has this issue been in a status?” for every issue that matches your filter. A per-issue table shows where work gets stuck, and chart mode turns the same hours into a donut, stacked bars or an area chart. Filter by project, sprint, epic, reporter or assignee to compare this sprint with the last one, or to find the bottleneck status inside an epic. Every number is counted in business hours.
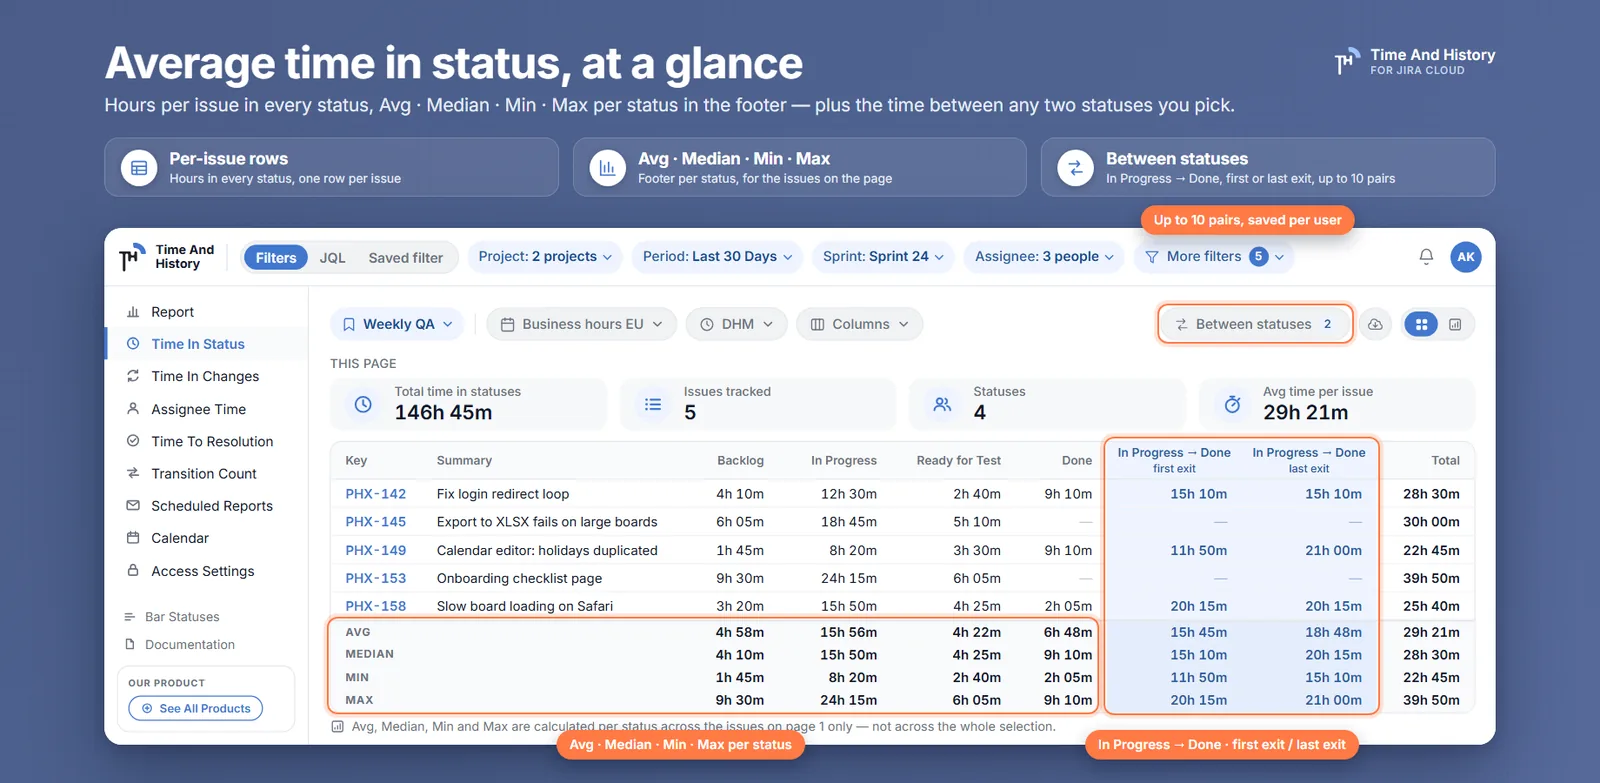
Per-status table — one column per workflow status, plus a footer with the average, median, min and max time per status for the issues on the current page of the table
Chart mode — share by status as a donut, or stacked bar and area charts grouped by day, week, month, quarter or year — or let Auto follow the date range
KPI tiles above the table — total time in statuses, issues tracked, statuses and average time per issue — captioned “This page” above the table, and “Whole selection” in chart mode, where they cover every issue the filters match
Time between two statuses — add a pair like In Progress → Done and the working time between them becomes a column of its own
Bottlenecks and stuck tickets — see the status where issues wait the longest and which tickets are sitting in it
Per sprint or epic — the same report scoped to one sprint, epic, reporter or assignee
Average time in status, at a glance — one row per issue, with hours in every status, plus a column for each pair of statuses you pick (In Progress → Done). The “This page” KPI tiles and the Avg · Median · Min · Max footer both cover the issues on the current page. Filters, not spreadsheets: project, sprint, epic, period, assignee.
Dashboard gadgets
Put working time per status on a Jira dashboard
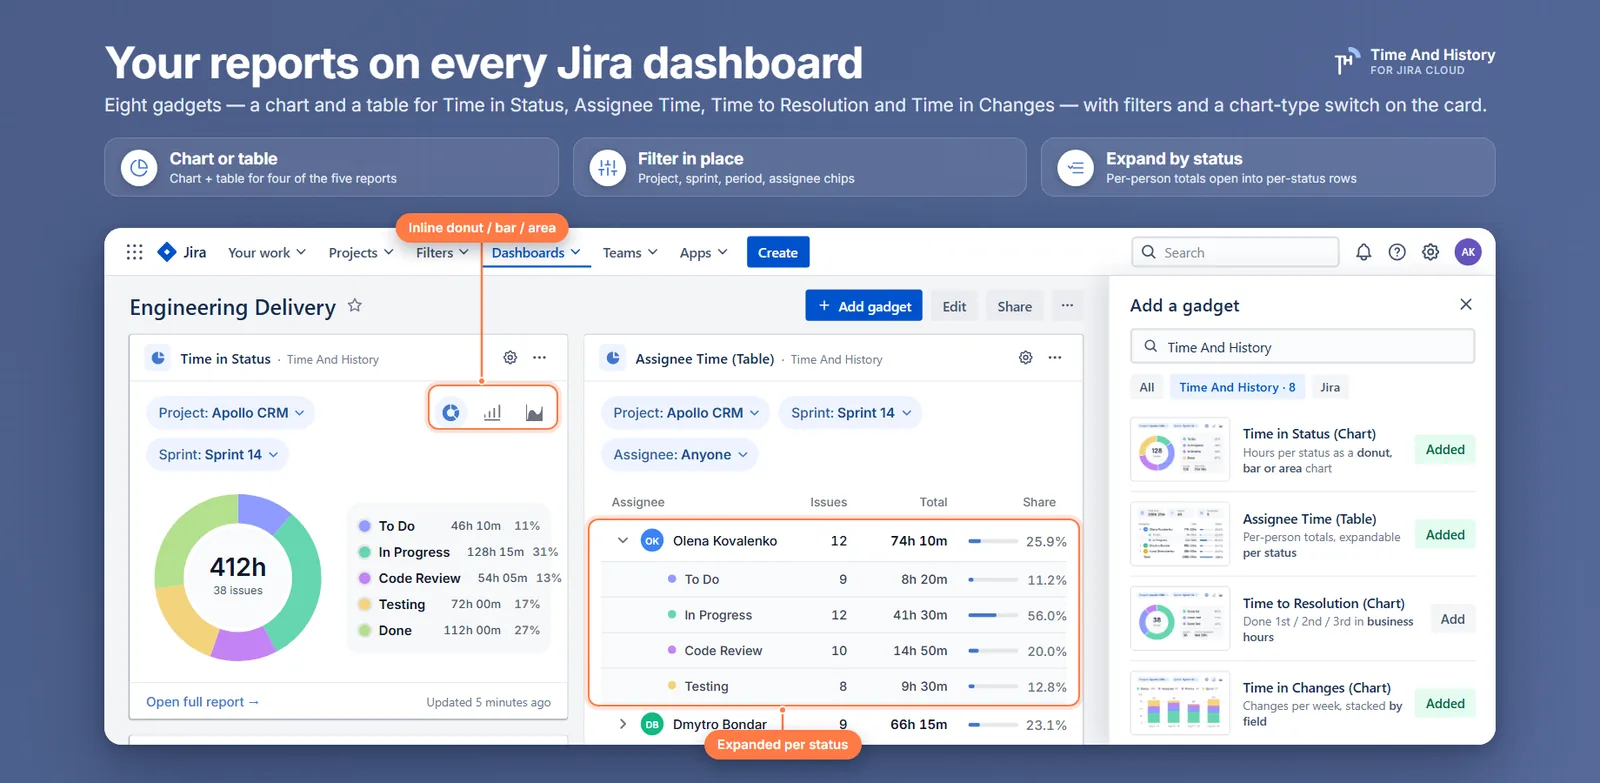
Gadgets put the reports where the question actually gets asked — Time in Status, Assignee Time, Time to Resolution, Time in Changes and Transition Count — with filters, a chart-type switch and per-status expansion right on the card, and each opens the full report with the same filters.
Chart or table — a chart and a table for each of the five reports; Between Statuses has no gadget
Filter in place — chips for project, sprint, period and assignee right on the card — epic, the saved chart type and, on gadgets that measure time, the time format live in the gadget settings
Donut, bar or area — switch the chart type inline on a chart gadget; a table gadget leads with KPI tiles for the totals
Expand by status — Assignee Time rows open into per-status rows for each person
Open full report — jumps to the report page with the gadget’s filters kept
Gadget settings — the gear holds the same filters plus epic, chart type, a custom-range date picker and, on gadgets that measure time, the time format; the work calendar is inherited from your own selection
Your reports on every Jira dashboard — chart or table, filter in place, expand by status.
New in 2.4
Time in Status on the Jira issue view: all five reports on the ticket
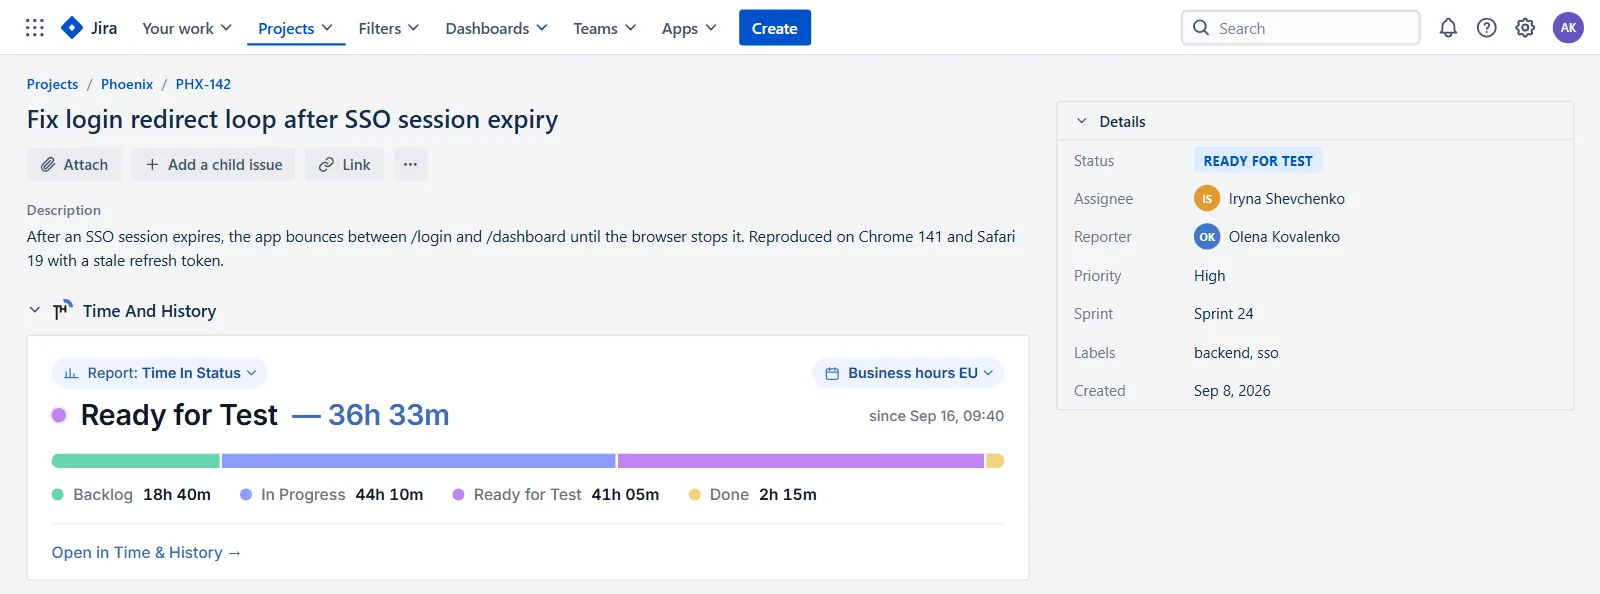
“How long has this ticket been in review?” is asked on the ticket, not on a report page. Add the Time And History panel to an issue from the Apps menu — once, for everyone who opens that issue — and the ticket answers under its own description: the status it is in now and how long it has been there, a bar and a legend for every status it passed, and a switch between all five reports. Working hours come from the calendar you pick on the panel, the same setting your reports use, and “Open in Time & History →” opens the full report on that issue.
Added from the Apps menu, per issue — the panel appears under the description once somebody adds it to that issue, and everyone who opens the issue sees it — it never turns itself on
All five reports — Time in Status, Assignee Time, Time to Resolution, Time in Changes and Transition Count, all read from the same issue history
The same working hours as the report — the calendar pill on the panel writes the setting your reports use, so the panel and the report page can never disagree
Counts, not hours, for Transition Count — that report counts transitions instead of measuring time, and the panel says so where the calendar would be
Five rows, then “+N more” — the panel stays short; the link at the bottom carries the issue into the full report with the same scope
Reads as you, writes nothing — the panel shows an issue only to someone who can already open it in Jira, and it never changes anything on the ticket
The answer where the question is asked — the Time And History panel under a ticket’s description: the “Report: Time in Status” switcher, the Business hours calendar pill, “Ready for Test — 36h 33m · since Sep 16, 09:40”, a segmented bar with a legend for every status the issue passed, and “Open in Time & History →”.
New in 2.4
Run any report on a JQL query or a Jira saved filter
The question is usually written already — as a JQL query, or as a filter somebody on the team saved in Jira. Since 2.4 any report runs on it as it is. The header switches between filter chips, raw JQL and your Jira saved filters, and whatever you pick drives the table, the chart, the export and the scheduled mail. The editor checks a query against Jira before it runs, and switching modes pauses your chips instead of clearing them.
Nine filter chips — project (multi-select, up to 10), period, sprint, assignee, issue type, epic, reporter, labels and components; project and period are pinned, and whatever does not fit the width collapses into a More filters chip with a badge
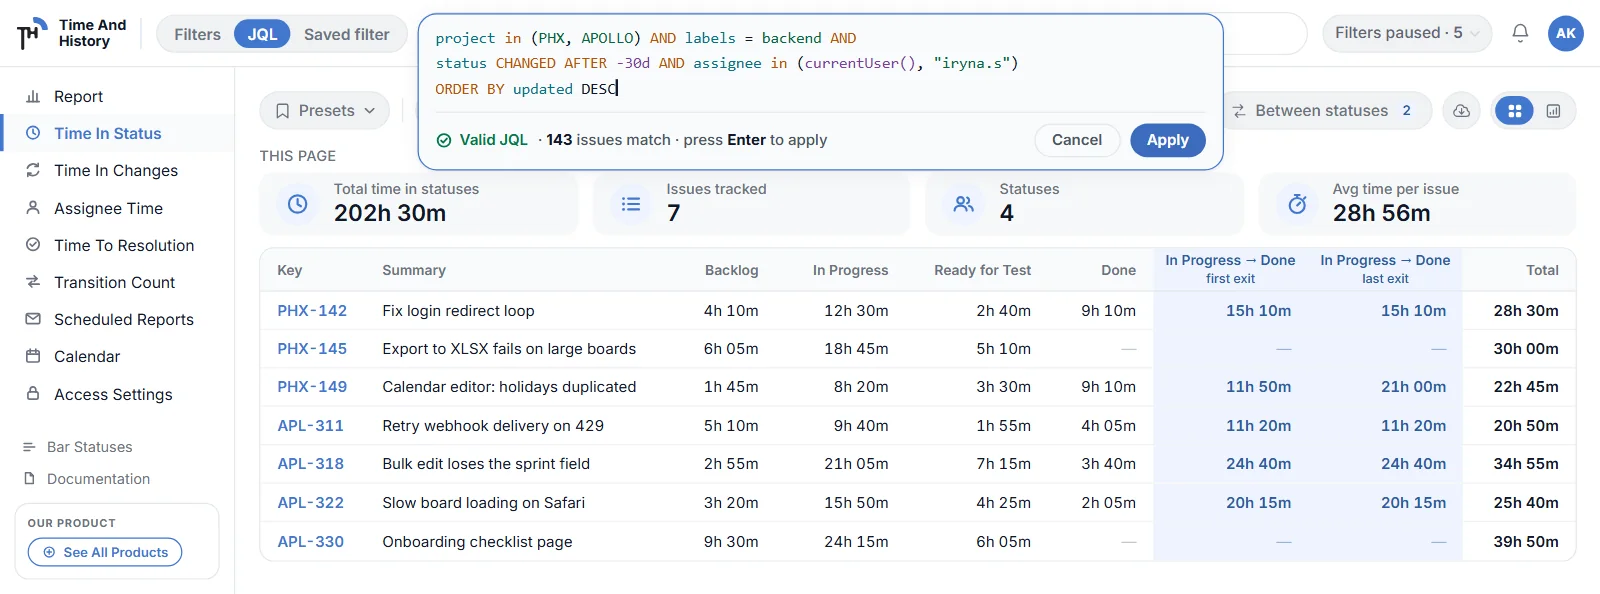
JQL mode — a raw query of up to 2,000 characters, syntax-highlighted, checked against Jira before it runs — “Valid JQL · 143 issues match” — so the count in the editor and the rows in the table agree
Saved filter mode — the Jira filters you starred, own or had shared with you, read as you; the resolved JQL sits read-only beside the chip with its match count
Filters paused, not cleared — the chips and the period are held while JQL or a saved filter is on, shown as “Filters paused · 5”, and come back untouched when you switch to Filters
Jira’s own error text — an invalid query is underlined and Apply stays blocked, with the message Jira returned rather than one of ours
A schedule on a saved filter stays live — a scheduled report built on a saved filter re-reads that filter on every run, as the schedule owner; one built on JQL keeps the query text frozen into the schedule
Your query, your report — the header switch on JQL, the editor open with a highlighted three-line query, “✓ Valid JQL · 143 issues match · press Enter to apply” under it, and the greyed “Filters paused · 5” chip that gives your chips back the moment you switch to Filters.
New in 2.4
Report presets: save a view and bring it back in one click
The same report, rebuilt every Monday: projects, sprint, period, calendar, columns. A preset does it once. It keeps the view under a name — the scope, the period, the working-hours calendar and the time format on any report, plus the columns and the Between Statuses pairs on the report it was saved on. Apply it in one click, press Update preset when it drifts or Revert to go back, and start a scheduled email report straight from it. Up to 50 per person, private to whoever saved them.
What a preset carries — the scope, the period, the work calendar and the time format everywhere; the columns (or History by Fields) and the Between Statuses pairs on its own report
What it never carries — table or chart mode, the chart type, the metric, the page size and the report itself — a preset configures the page you are on, it never navigates you somewhere else
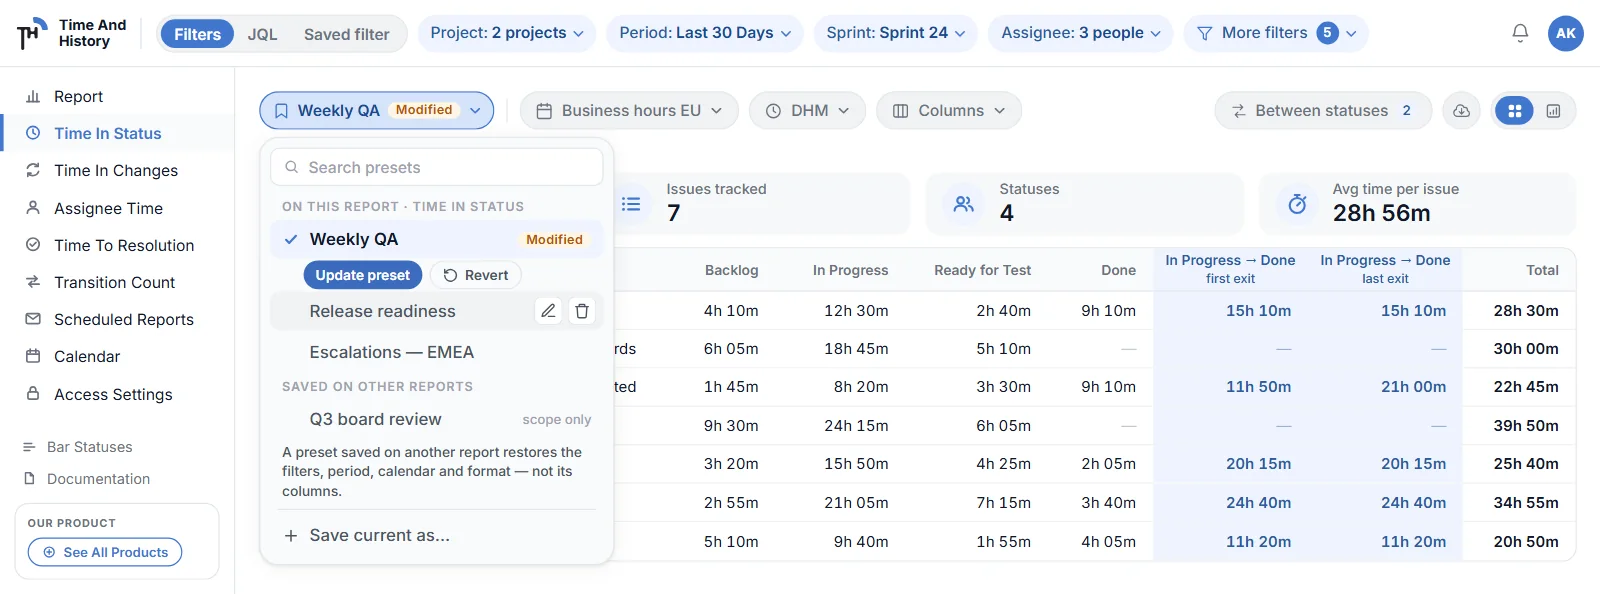
Apply, Update, Revert — applying a preset becomes your current view; change anything and the pill reads Modified, with Update preset and Revert under the row
Scope only from another report — a preset saved on a different report restores the first block alone, and the menu says so on the row
Private, 50 per person — presets are personal — nobody else sees or changes yours — and names are unique per person, regardless of case
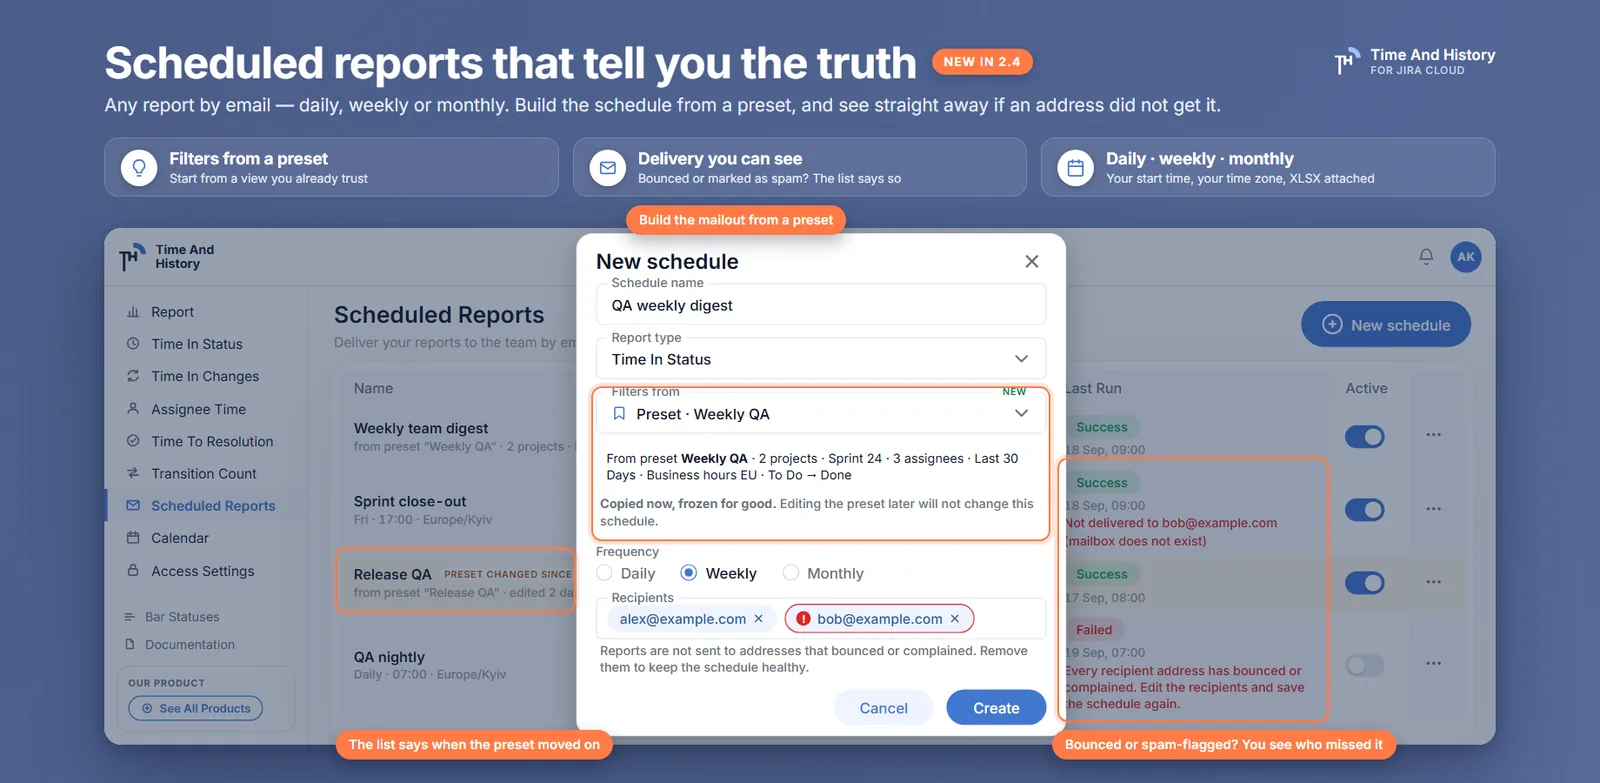
Schedules can start from one — a schedule copies the preset’s filters when it is created; edit the preset later and the row is badged Preset changed since, with “Use the preset’s current filters” waiting in the editor
Stop rebuilding the same report every Monday — the Presets menu lists what you saved on this report, the applied one tagged Modified with Update preset and Revert under it, and the presets saved on other reports below, marked “scope only”.
Scheduled reports
Scheduled email reports: send a Jira Time in Status report daily, weekly or monthly
A scheduled report sends Time in Status — or any of the five reports — by email: daily, weekly or monthly, at the time and time zone you choose, with the filters you set on the report page frozen into the schedule, or taken from a preset. The XLSX is attached, it goes to up to ten recipients you type yourself, and every run is listed in Export History. Since 2.4 the list also shows delivery: an address that bounced or marked the mail as spam is flagged on the run and on the recipient, so a silent mailout is not a thing.
Any report — Time in Status, Assignee Time, Time to Resolution, Time in Changes or Transition Count
Daily, weekly or monthly — you pick the start date, the start time and the time zone; the schedule tells you when it runs next
Up to 10 recipients — addresses you type yourself — nobody is added implicitly
Start from a preset — a schedule can take its filters from one of your presets, and the row says so; edit the preset afterwards and the row is badged Preset changed since
Delivery you can see — a bounced or spam-flagged address gets a marker on the recipient and a “Not delivered to …” line under the run, with the reason. There is no retry — the fix is to remove the address — and a schedule left with no deliverable address is switched off
XLSX attached — a file larger than 7 MiB is not attached; the mail says to download it from Export History instead
Every run in Export History — scheduled runs land in the same list as your hand-started exports
Runs as the schedule owner — the report is collected with the owner’s Jira access, so recipients see the owner’s view
The report comes to you, and you can tell whether it arrived — pick the report, the frequency and the hour, take the filters from a preset if you have one, and the XLSX lands on that clock. A run that could not reach somebody says so: “Not delivered to [email protected] (mailbox does not exist)”.
Between Statuses
Time between two statuses in Jira: In Progress → Done, in business hours
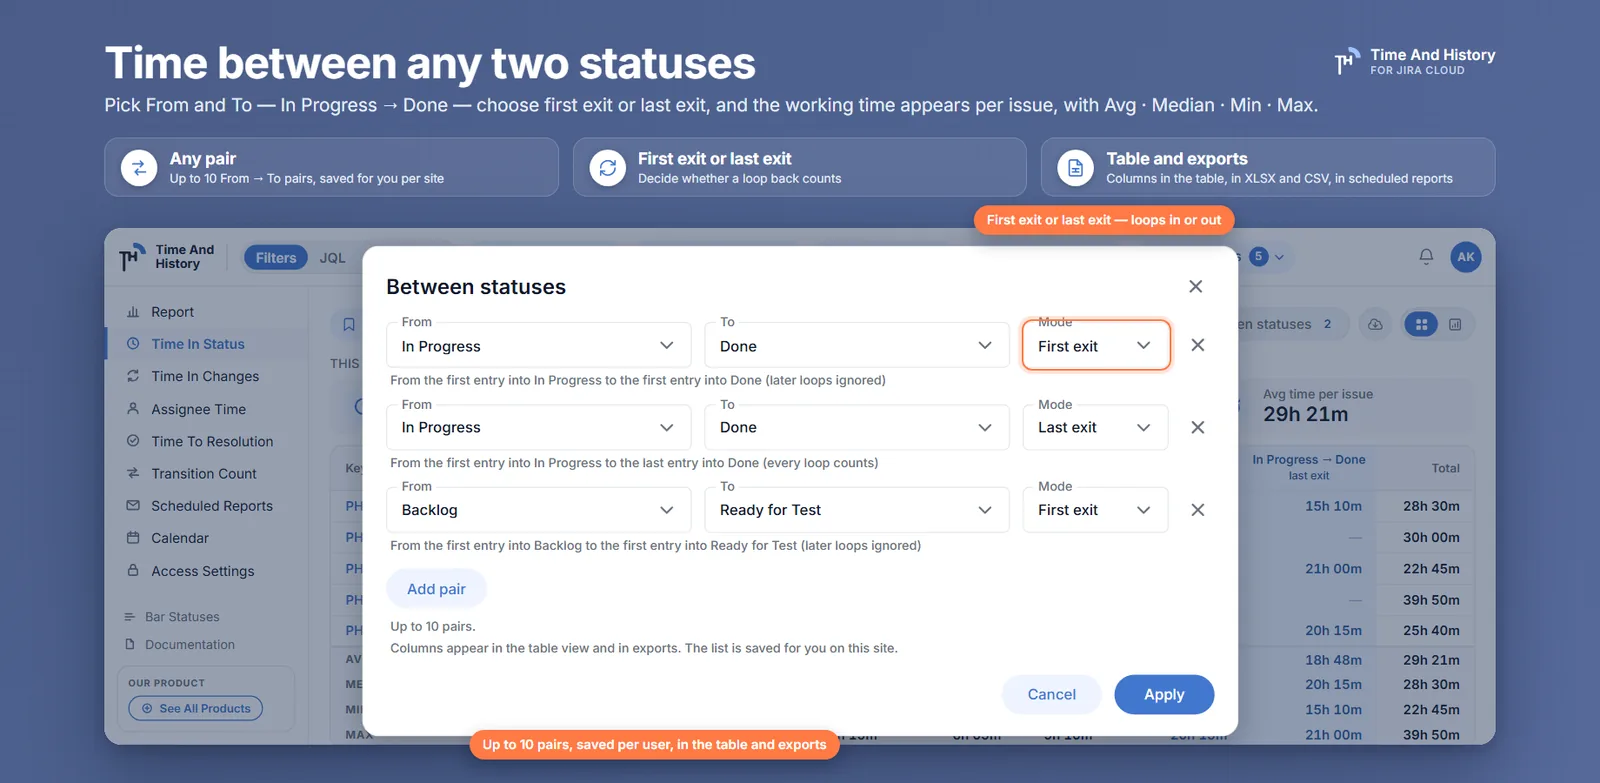
The time between two statuses in Jira, as a column: pick any two statuses on Time in Status and the working time between them becomes a column — In Progress → Done — with average, median, min and max in the footer for the issues on the current page. Choose first exit (the first entry into A to the first entry into B, later loops ignored) or last exit (to the last entry into B, so every loop counts). Up to ten pairs, saved for you, in the table and in every export.
Up to 10 pairs — each pair adds one column to the Time in Status table, in the order you added them
First exit or last exit — decide whether a loop back through the workflow counts — first exit stops at the first entry into the second status, last exit waits for the last one
Saved per user — your pairs come back next session and change nobody else’s report
In every export — the columns travel into XLSX and CSV alike, and into a Time in Status schedule
How long from In Progress to Done? Pick From and To, choose first exit or last exit, and the working time appears per issue — up to ten pairs, in the table and in every export.
Transition Count report
Transition Count: how many times a Jira issue changed status
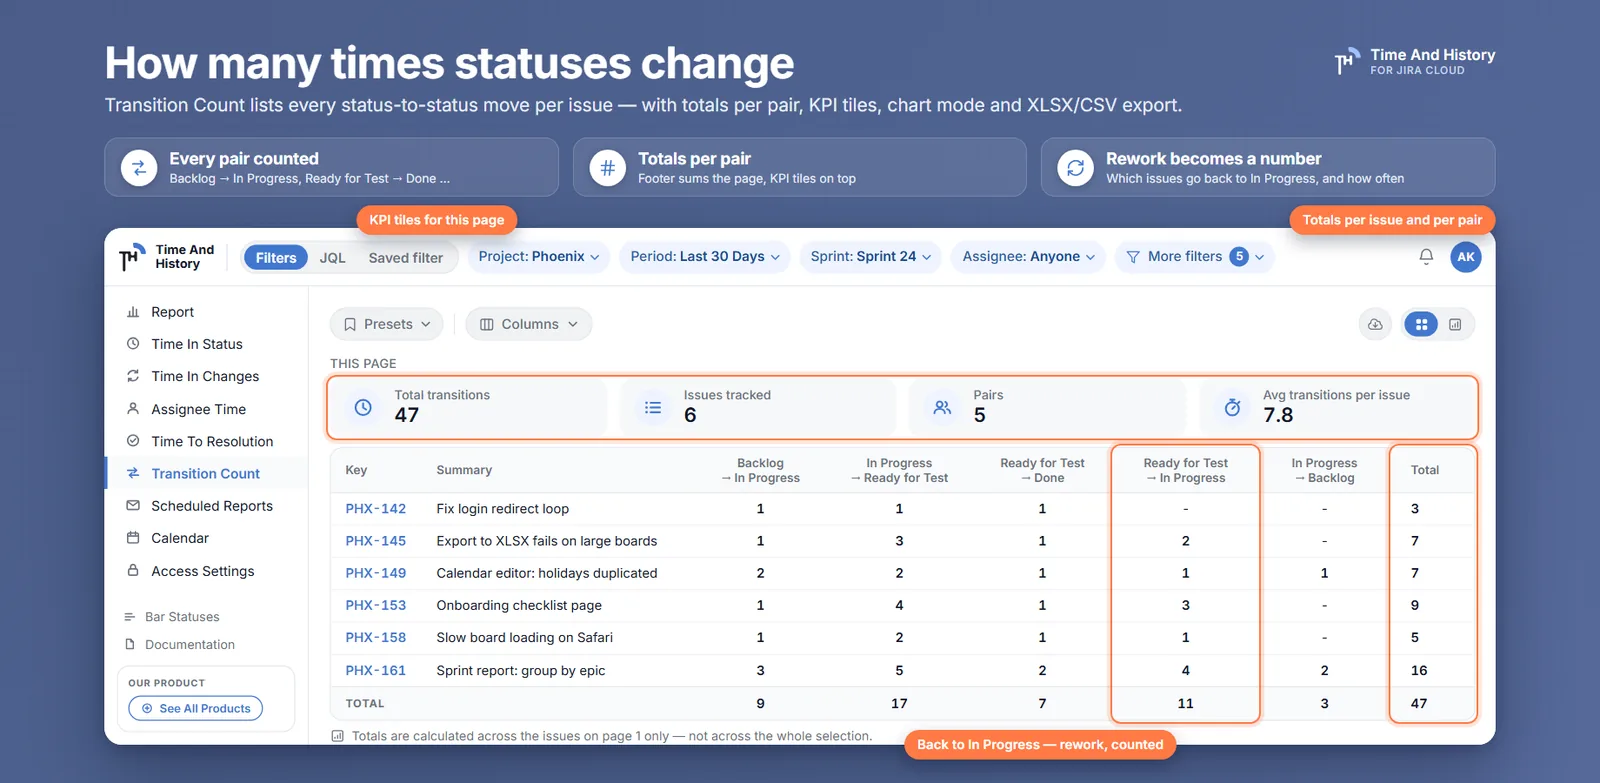
Transition Count is the fifth report, and it counts every status-to-status transition per issue — Ready for Test → In Progress: 3 — with a column per pair, a Total column and a TOTAL row. Rework stops being a feeling and becomes a number you can sort, chart, export to XLSX or CSV and put on a Jira dashboard.
One column per status pair — every pair the issues actually went through, counted per issue
Totals per issue and per page — a Total column for each issue and a TOTAL row covering the issues on the current page, not the whole selection
Chart mode and KPI tiles — total transitions, issues tracked, pairs and average transitions per issue — “This page” above the table, “Whole selection” in chart mode
Same filters — project, sprint, epic, reporter, assignee and date range, like every other report
No work calendar or time format — it counts events rather than time, so business hours do not change the number
On a dashboard too — a chart gadget and a table gadget put the rework count on the team’s Jira dashboard
Count the round trips — how many times each status pair occurred, per issue, with a Total column and a TOTAL row for the issues on the current page. The tickets that keep going back to In Progress stop hiding.
Assignee Time report
Assignee Time: time with each assignee
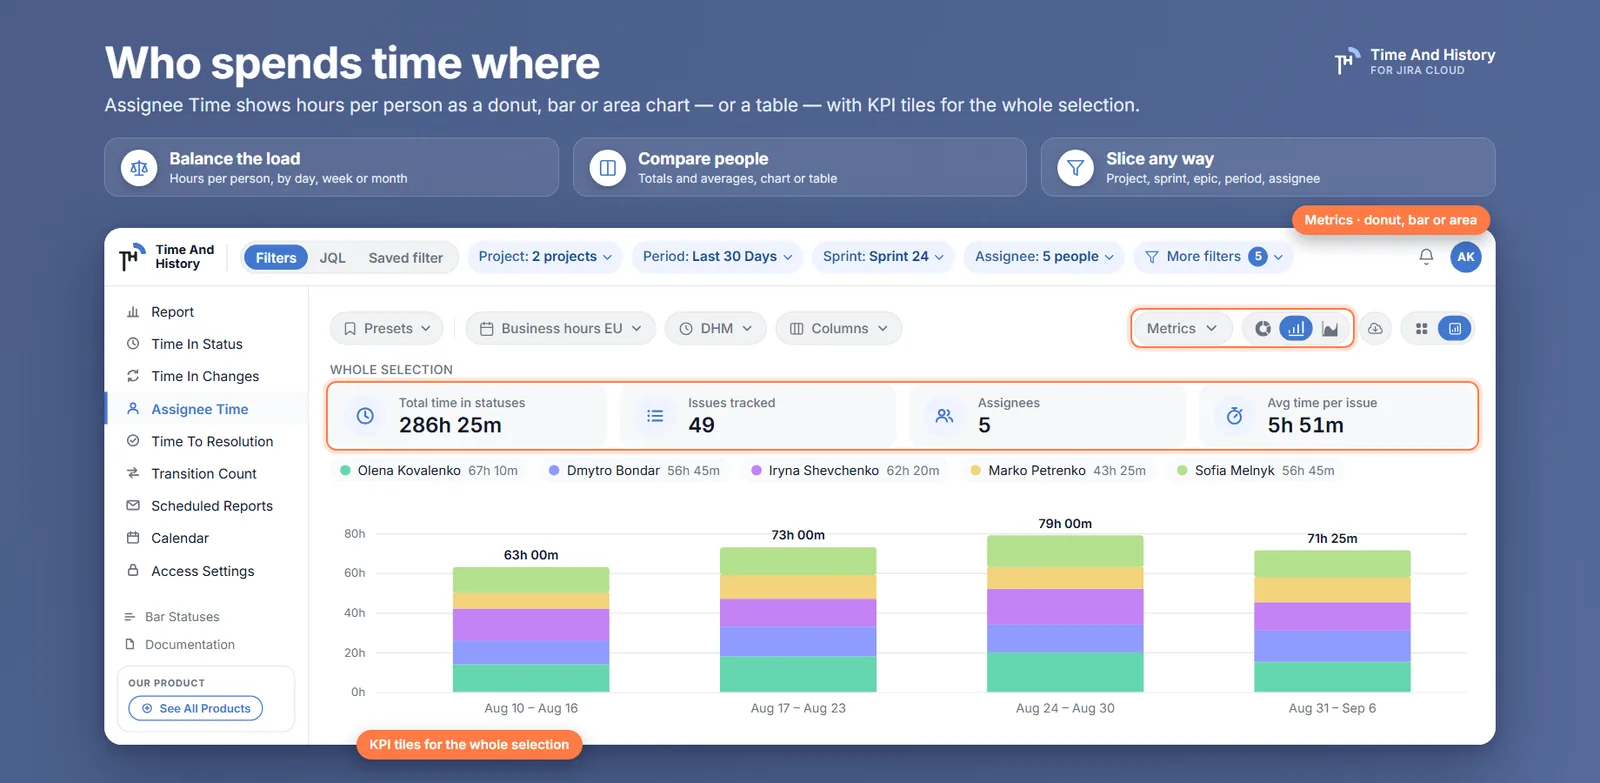
Assignee Time shows how long every issue spent with each person — one column per assignee, an Unassigned column for time nobody owned, and a Total Time From Create Issue column. When a ticket moves between people, the time goes to whoever held it, so reassignments stop hiding effort.
Hours per assignee — one column per person plus an Unassigned column for the time nobody owned
Per status on the dashboard — the report page keeps one column per person; the per-status breakdown is the Assignee Time (Table) gadget, which expands each person into per-status rows
Totals and KPI tiles — a Total Time From Create Issue column per issue, and tiles above the table for total time in statuses, issues tracked, assignees and average time per issue — “This page” above the table, “Whole selection” in chart mode
Chart mode — the same hours as a donut, stacked bars or an area chart, grouped by day, week, month, quarter or year
Any slice — by project, sprint, epic, period or assignee
Who spends time where — chart mode stacks the hours per assignee per week over the whole selection, and the table gives every issue a column per person. The per-status breakdown is the Assignee Time (Table) gadget.
Time in Changes report
Time in Changes for Jira Cloud: the issue history report Jira does not have
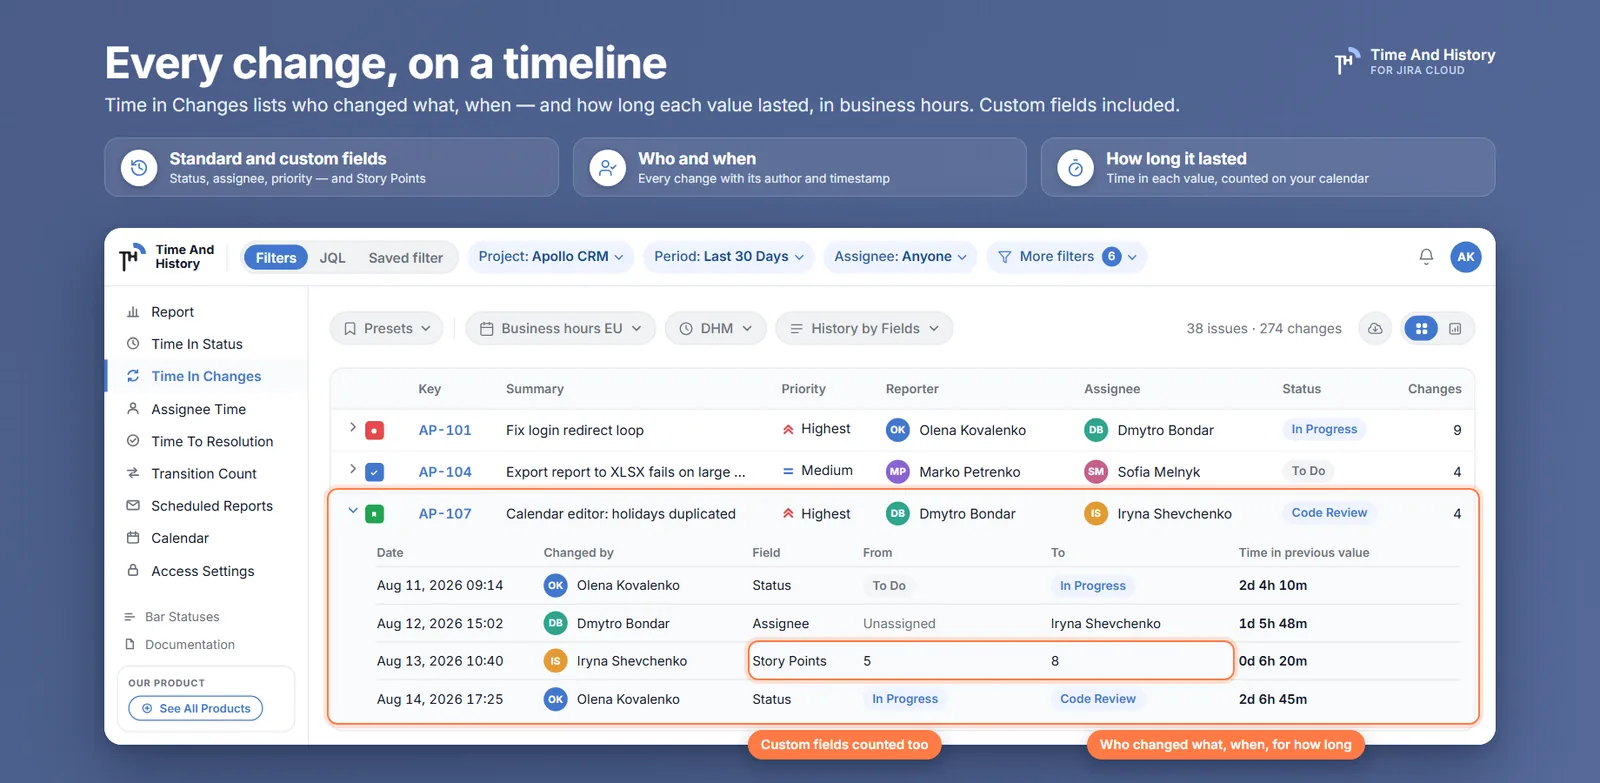
Time in Changes reads the issue changelog into a report. It covers status, assignee, priority, summary, issue type, reporter, description, labels, due date and resolution — and, since 2.4, custom fields such as Story Points. Every change shows who made it, when, the old and new value, and how long the old value lasted — in business hours. It is the issue history report Jira does not have: expand any issue to read its whole history, field by field, and choose which fields appear.
Who changed the status — every transition with its author, timestamp and the time spent in the previous status. A change row, read column by column, is in Jira status change history.
Standard fields — assignee, priority, summary, issue type, reporter, description, labels, due date and resolution — the same who, when and how long for each
Custom fields, new in 2.4 — Story Points, Sprint and any other custom field Jira records in the issue changelog are read alongside the standard ones
History by fields — choose which fields appear in the drill-down; each field lists its changes oldest to newest, ending with the current value and the time since the last change
Every change, on a timeline — the full field history with who and when, and how long each value lasted, in business hours; status and assignee next to a Story Points 5 → 8 row, because custom fields count too.
Time to Resolution report
Time to Resolution for Jira Cloud: every resolution pass, in business hours
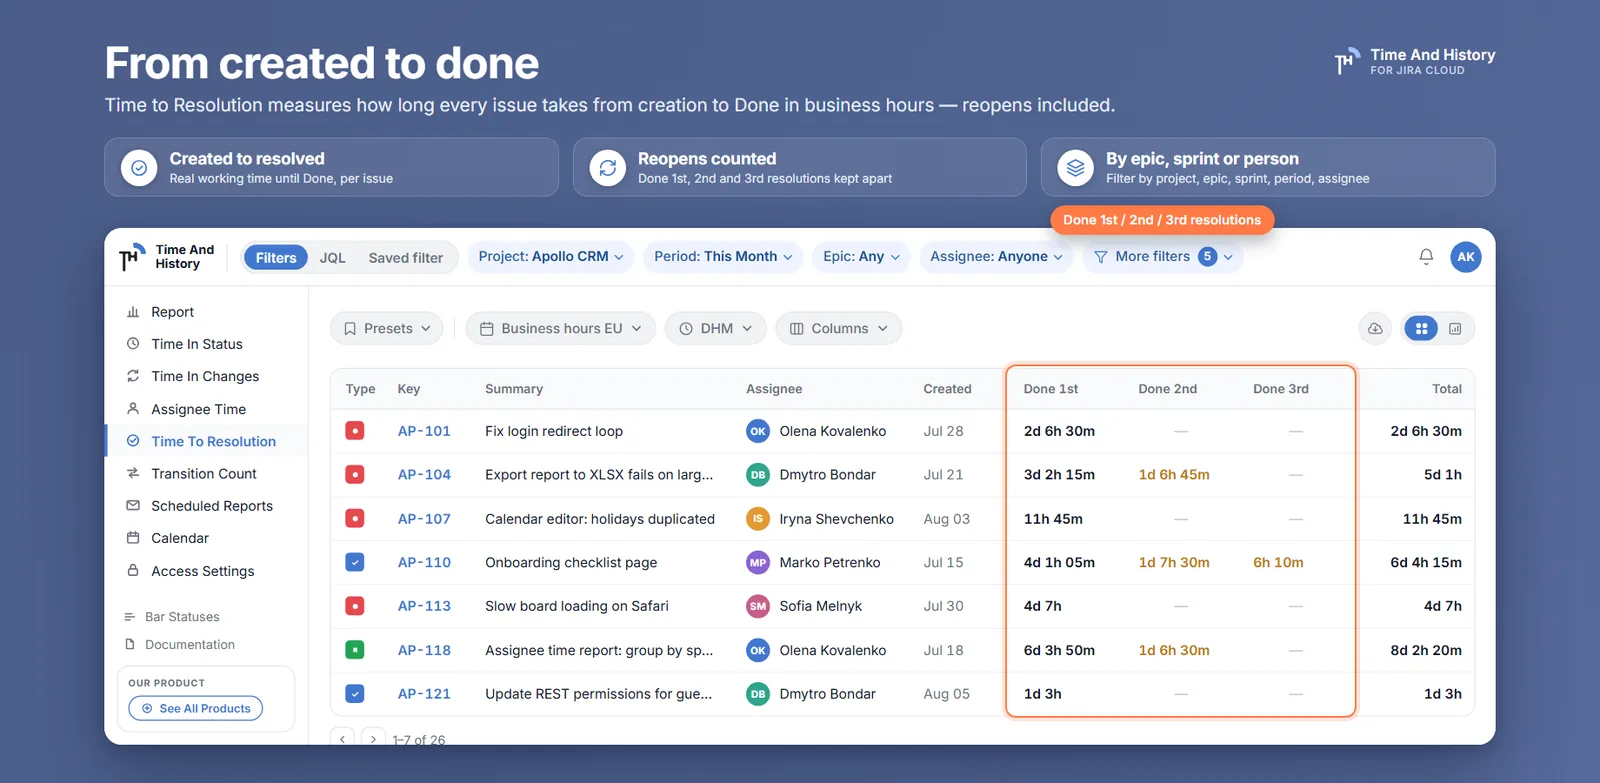
Time to Resolution measures the working time an issue takes to reach each of its resolutions. Every resolution pass gets its own column, so you see how many times an issue came back and what the rework cost. It also lets you track resolution times for support or bug projects without Jira Service Management, and compare them with the target you promised.
Working time to resolution — per issue, against your work calendar
Reopened issues — each pass in its own column, named after the resolution with an ordinal — Done 1st, Done 2nd
Total time to resolution — the working time across an issue’s resolution passes; the stretch it spends already resolved is not counted
SLA tracking without JSM — a resolution-time report for any Jira Software project
Resolution times issue by issue — the working time to each resolution, reopens kept apart, by epic, sprint or person.
Work calendars
Work calendars: business days, hours, time zones and yearly holidays
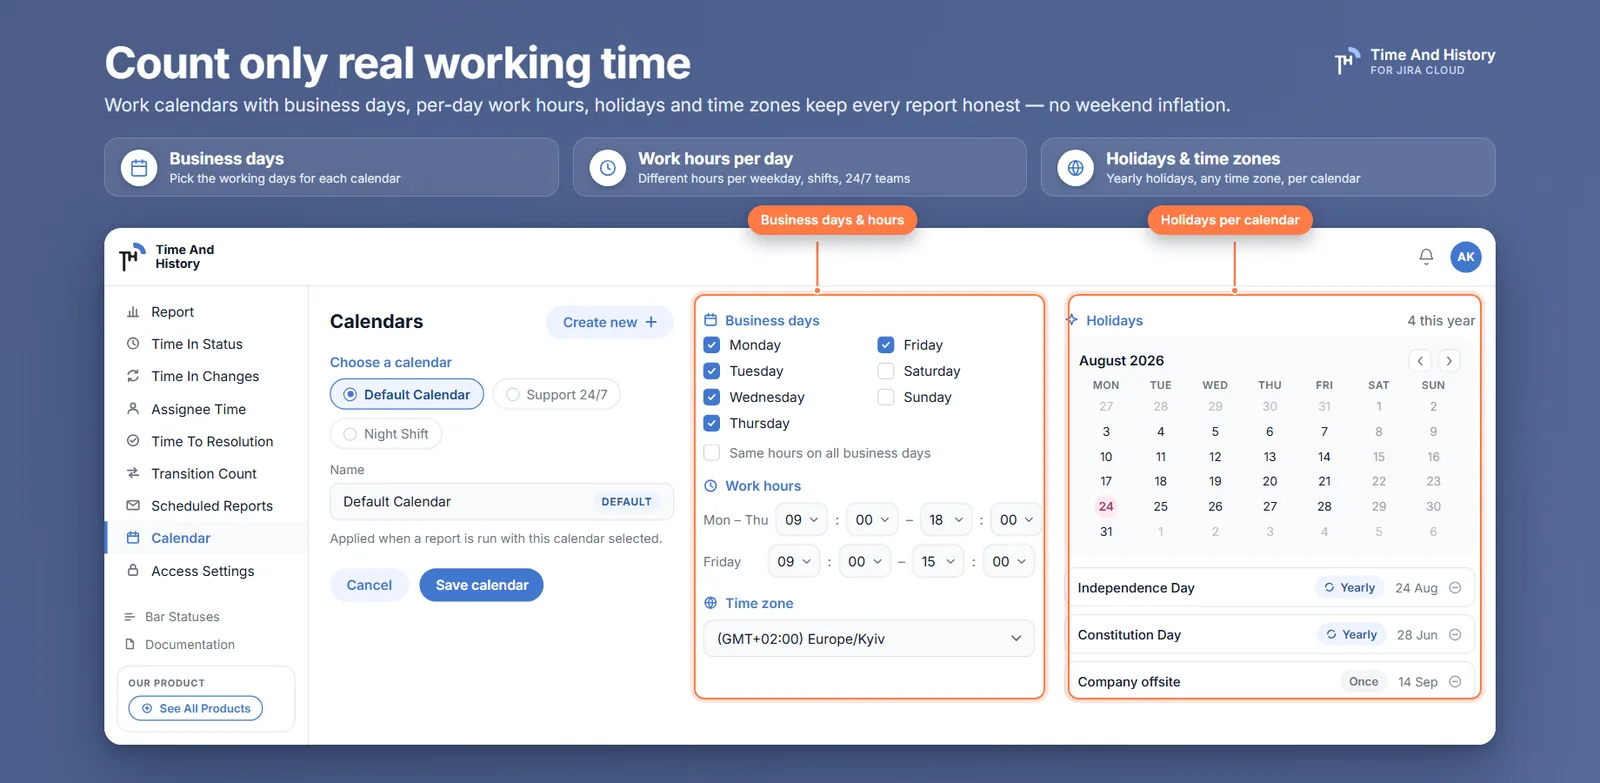
Work calendars set business days, per-day hours, a time zone and holidays that repeat every year — and every report that measures time follows them. Weekends and days off never inflate a number, so a ticket opened on Friday evening is not three days old on Monday. Create several calendars for teams in different regions and pick the one that matches the team you are looking at. Your work calendar is a personal setting: pick it once and Time And History remembers it for you across sessions, applying it to every report that measures time — Time in Status, Assignee Time, Time to Resolution and Time in Changes — and to every dashboard gadget you view, without changing anyone else’s results.
Business days and hours — which days count and how many hours each
Time zones — one calendar per office
Holidays — a yearly list, repeated automatically
Several calendars — switch between them right from the report; the choice is yours alone and follows you to every report that measures time and to every gadget
Except Transition Count — that report counts events rather than time, so it has no work calendar and no time format
Count only real working time — business days, work hours per day, holidays and time zones keep every report honest, with no weekend inflation.
Exports
Share any report outside Jira — Excel, CSV or PNG
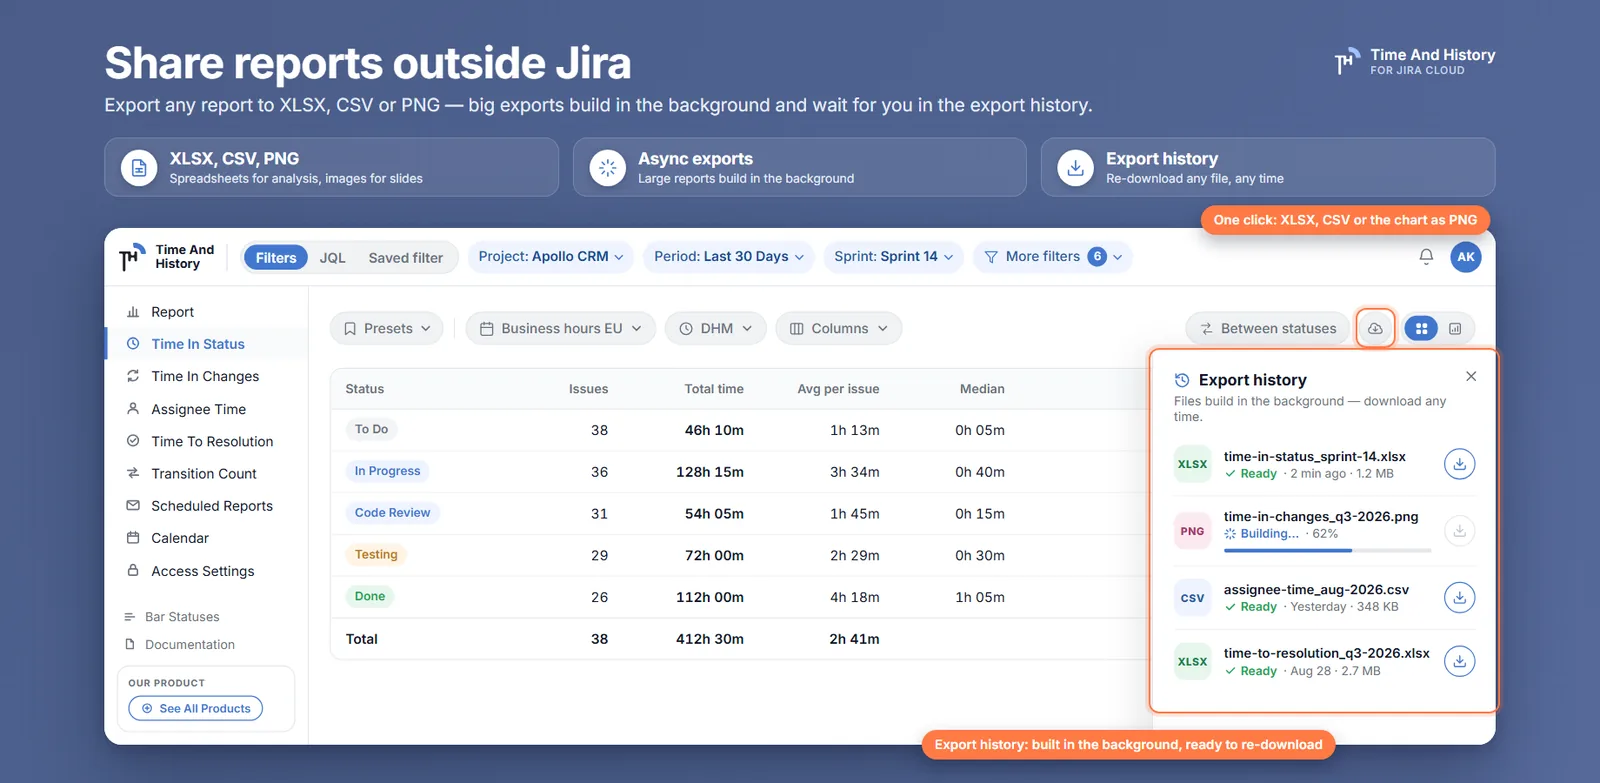
One click exports any of the five reports to Excel (XLSX) or CSV, and the open chart to PNG from chart mode on any report. Large exports build in the background and land in the export history, ready to download whenever you come back — no waiting on the page.
Excel — the full table with its totals, plus the chart images when you export from chart mode; Time in Status, Assignee Time and Time to Resolution add a chart-data sheet, Transition Count a totals sheet
CSV — for your own pivots and BI tools — Between Statuses columns included
PNG — the open chart as an image for a slide or a status update, from chart mode on any report
Export history — every export covers all matching issues, runs in the background, and your 20 most recent files stay ready to download. Scheduled runs land in the same list
Share reports outside Jira — export any of the five reports to XLSX or CSV, and the open chart to PNG; async exports build in the background and wait for you in the export history, alongside your scheduled runs.
Dark mode
Time in Status for Jira Cloud, in dark mode too
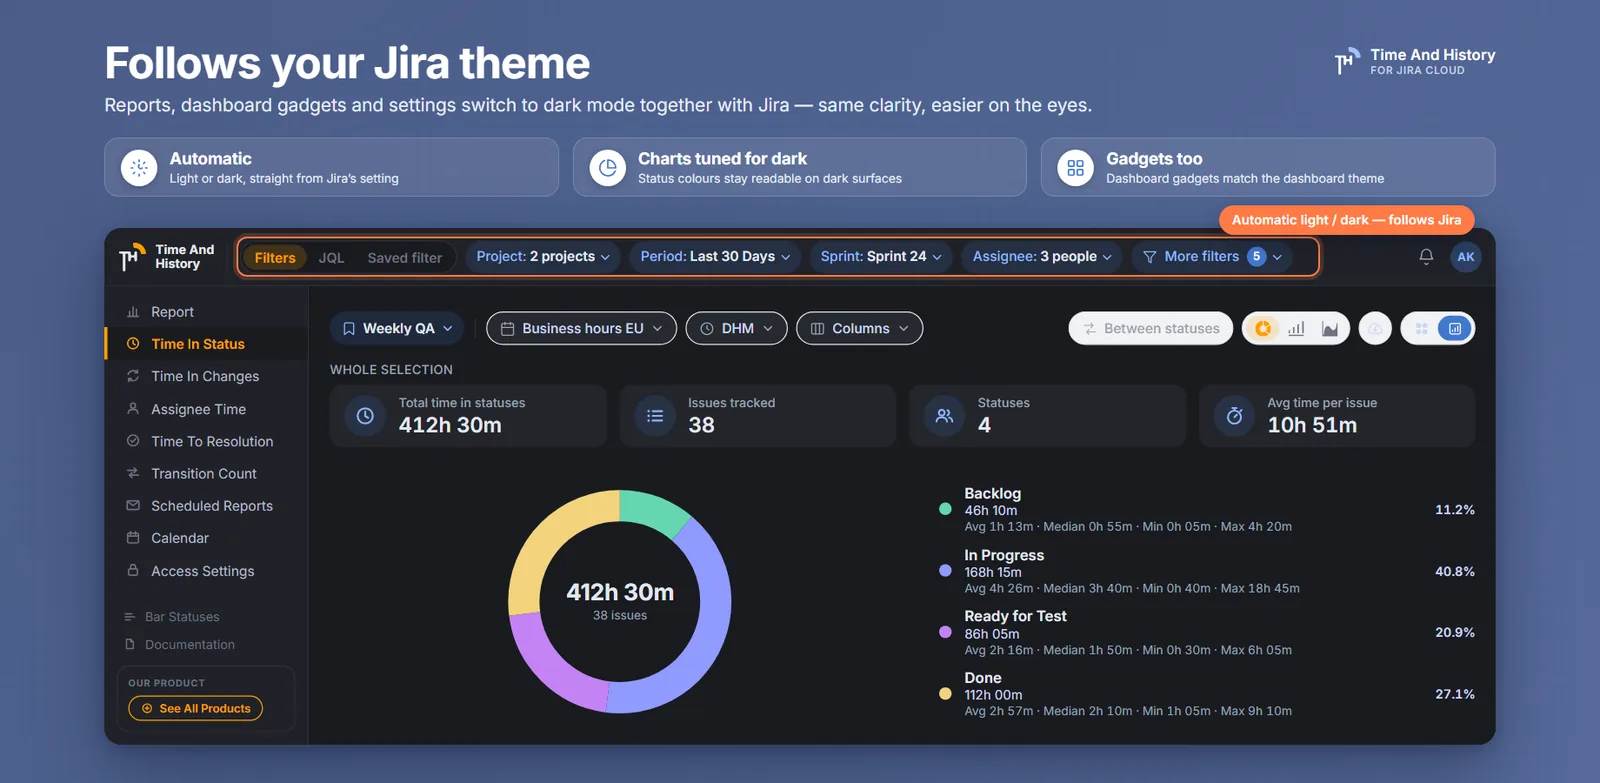
Dark mode is automatic: every report, dashboard gadget, the issue view panel and every settings page switches with your Jira Cloud theme, and status colours stay readable in both. Nothing to configure — it looks and behaves like part of Jira, not a separate tool.
Follows the Jira theme — light or dark, with no in-app switch to remember
Charts tuned for dark — tables, charts and dialogs keep the same clarity in both themes
Gadgets and the issue panel too — dashboard gadgets match the dashboard around them, and the panel on the issue view matches the issue
Follows your Jira theme — reports, dashboard gadgets and settings switch to dark mode together with Jira, automatically, with charts tuned for dark and gadgets too.
Access settings
Who sees what: report access by Jira group
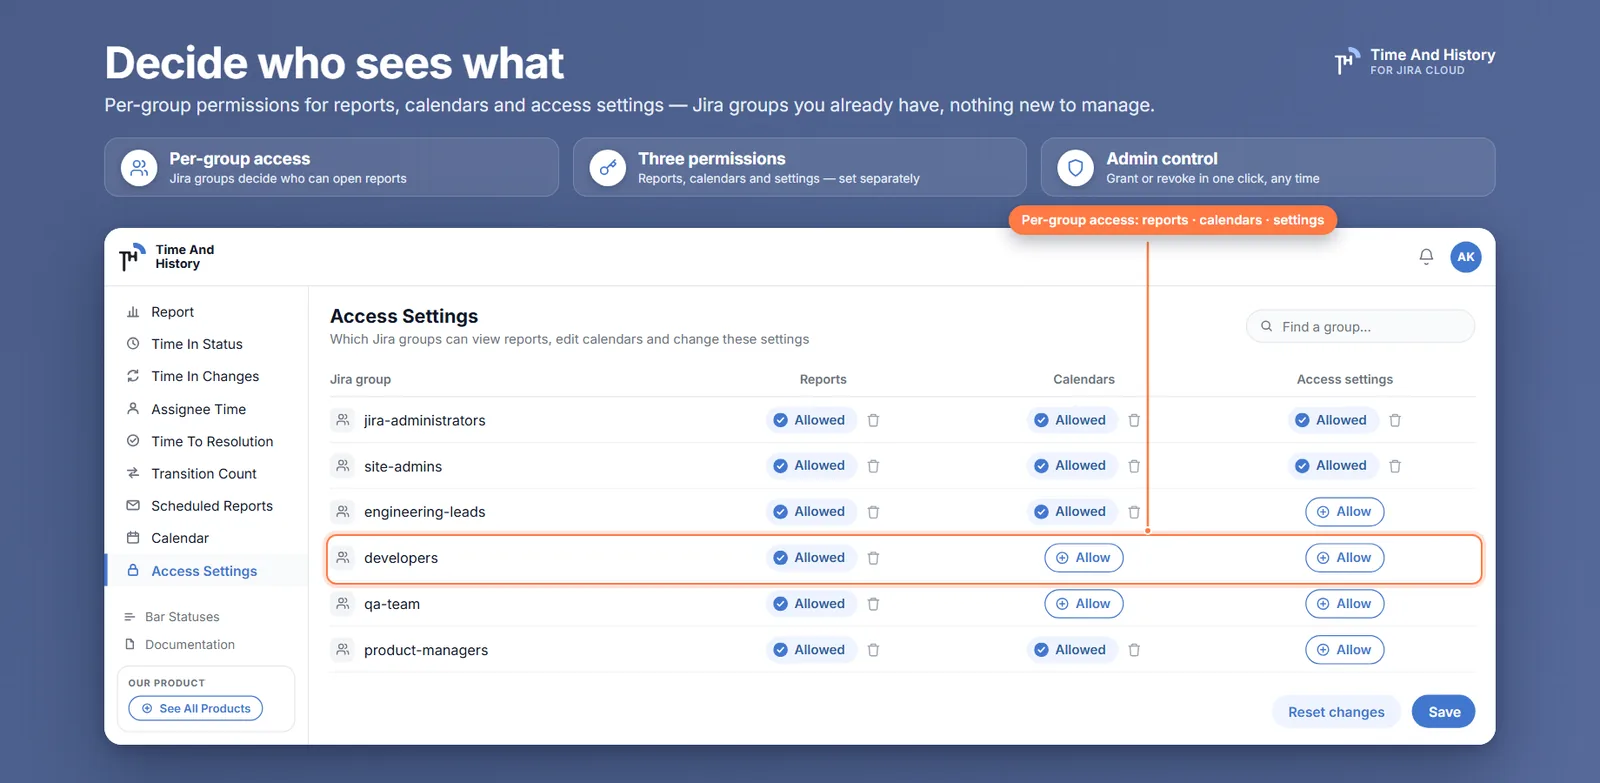
Access settings decide per Jira group who can view Time in Status and the other reports, who edits work calendars and who manages access. Grant or revoke with one click using the Jira groups you already have — nothing new to manage.
Reports — which groups can open the report pages
Calendars — who can create and edit work calendars
Permissions — who can change the access settings themselves
Admins keep control — Jira admin groups always keep full access and cannot be locked out
Your own Jira permissions still apply — every Jira read runs as the person looking, so a report, a gadget and the issue view panel each show only the issues that user can open in Jira. A scheduled run collects as the schedule owner, so its recipients see the owner’s view
Decide who sees what — per-group access with three permissions (reports, calendars, access settings) and admin control, using the Jira groups you already have. Inside a report, every viewer sees only the issues their own Jira permissions allow.
Who uses Time And History
Team leads
Balance the workload with Assignee Time: see how long issues sit with each person, find who is overloaded and who has capacity, and move work before the sprint slips.
Project managers
Find the bottleneck status with Time in Status charts, put the same chart on the project dashboard as a gadget, and keep delivery predictable with Time to Resolution in business hours.
Support managers
Track resolution times without Jira Service Management: Time to Resolution shows created-to-done per issue, counts reopened tickets and follows your business-hours calendar.
Scrum masters
Run retros on real numbers: filter Time in Status by sprint or epic, compare it with the previous one and export the table to Excel for the meeting notes.
Rated 5/5 on the Atlassian Marketplace
5.0 out of 5 from 4 reviews — an early sample, and a public one: every review, and our reply to it, is on the listing.
Put the gadget on the team dashboard and managers stopped asking me for numbers every week. That alone changed my Mondays.
Yuki NakamuraJira Cloud · 6 September 2026
We have around forty thousand worklogs and reports still come back in a couple of seconds. I expected much worse at this size.
Time in Status for Jira: frequently asked questions
Open Time And History, choose the Time in Status report and filter by project — and by sprint, epic or assignee if you like. The table shows the working time every issue spent in each status, with a footer giving the average, median, min and max per status for the issues on the current page. Chart mode shows the same time as donut, bar or area charts. Jira itself only lists the transitions in the issue history; the report turns them into durations.
Yes. The Time in Status table has a footer with the average, median, min and max time per status for the issues on the current page, and KPI tiles above it — total time in statuses, issues tracked, statuses and average time per issue — captioned “This page”. Switch to chart mode and the same tiles are captioned “Whole selection” and cover every issue your filters match. Averages follow the work calendar, so weekends and holidays are not counted.
Yes, since 2.4. The report header has a Filters | JQL | Saved filter switch: paste a query of up to 2,000 characters and every report runs on exactly that JQL — table, chart, export and scheduled mail — or pick one of the Jira filters you starred, own or had shared with you, which is read with your own access. The editor checks the query before it runs and shows “Valid JQL · N issues match”, or Jira’s own error message when it is wrong. Your filter chips and the period are paused while either mode is on, not cleared, and they come back when you switch to Filters.
Yes. Add the Time And History panel to the issue from the Apps menu — once, and everyone who opens that issue sees it under the description: the status the issue is in now with the time it has been open, a bar and a legend for every status it passed, and a switch between all five reports — time per status, per assignee, to resolution, the field changes and the transition count. It counts working hours from the calendar you pick on the panel, which is the same setting your reports use, and a link opens the full report on that issue. The panel never writes to the ticket and shows it only to people who can already open it in Jira.
That is what presets do. A preset remembers the view under a name — the scope (chips, JQL or a saved filter), the period, the working-hours calendar and the time format on any report, plus the columns and the Between Statuses pairs on the report it was saved on. Apply it in one click, press Update preset when the view drifts or Revert to go back, and build a scheduled email report straight from it. Presets are personal, up to 50 per person; they do not carry table or chart mode, the chart type or the page size, and a preset saved on another report restores the scope only.
Yes. Set the filters on a report page — or pick one of your presets — open Scheduled Reports and create a schedule: any of the five reports, daily, weekly or monthly, at the start date, time and time zone you choose. The report is generated on that clock and mailed as an XLSX to up to ten recipients you type yourself. The filters are frozen when the schedule is created, and every run is listed in Export History. A run collects as the schedule owner, so recipients see the owner’s view of Jira. If an address bounces or marks the mail as spam, the run says “Not delivered to …” and the recipient is flagged; there is no retry, so the fix is to remove that address.
On Time in Status, open Between statuses and add a pair — In Progress → Done. Each pair becomes a column of working time per issue, with average, median, min and max in the footer for the issues on the current page, and it travels into every export and into a Time in Status schedule. Choose first exit (later loops ignored) or last exit (every loop counts). Up to ten pairs, saved for you.
The Transition Count report counts every status-to-status transition per issue: one column per pair, a Total column per issue and a TOTAL row for the issues on the current page. It is how you count reopens and rework without reading changelogs by hand, and it exports to XLSX or CSV.
Yes — Time And History adds a chart gadget and a table gadget for every report: Time in Status, Assignee Time, Time to Resolution, Time in Changes and Transition Count. Between Statuses lives on the Time in Status report page and has no gadget.
Yes. Work calendars define business days, per-day hours, a time zone and holidays that repeat every year, and every report that measures time counts business hours only. The choice is a personal setting, remembered for you across sessions and applied to every report and gadget you open, without changing anyone else’s results.
Press Export on any of the five reports and choose Excel (XLSX) or CSV; chart mode adds a PNG of the open chart on any report. The export covers all issues matching the filter, not just the visible page, and builds in the background.
The Time in Changes report lists every change from the issue changelog, and each entry shows who made the change, when, the old and new value, and how long the old value lasted. It covers status, assignee, priority, summary, issue type, reporter, description, labels, due date and resolution, and since 2.4 custom fields such as Story Points as well. Expand an issue to read its full history, field by field, and use History by Fields to choose which fields are listed.
Time to Resolution keeps each resolution pass in its own column, named after the resolution value with an ordinal — Done 1st, Done 2nd — so an issue that came back twice shows three resolution times side by side. A column appears when a resolution is set, so that count covers the reopens that were resolved again; for the return trips themselves, open ones included, Transition Count counts how many times each status pair occurred per issue.
Time And History does not define SLA rules, but Time to Resolution gives you the number an SLA is measured against: the working time to each resolution, per issue, on your work calendar. Compare it with your target for any Jira Software project — no Service Management licence required.
Yes. All five reports filter by project, sprint, epic, reporter, assignee and date range, and the dashboard gadgets by project, sprint, epic, period and assignee. So you can compare one sprint with the previous one, or see where the issues of an epic waited longest. Transition Count is the one report with no work calendar and no time format — it counts events, so no working time is involved.
No, and that is deliberate: every Jira read runs as the person viewing the report, so each viewer sees only the issues their own Jira permissions allow. Access settings decide per Jira group who can open the reports at all. The one exception is a scheduled report: the run collects as the schedule owner, so its recipients see the owner’s view.
Pricing follows Atlassian’s standard Cloud tiers: free for up to 10 users, then a per-user monthly subscription with a free trial for larger sites. Subscriptions, trials, renewals and refunds are handled by Atlassian through the Marketplace, in your Atlassian billing console.