
Standup, third minute. "PHX-142 — what's the hold-up?" Somebody opens the ticket, scrolls to Activity, switches to History, hovers a relative date to turn last week into a timestamp, hovers a second one, subtracts in their head, and says "about three days, I think". By then the meeting has moved on.
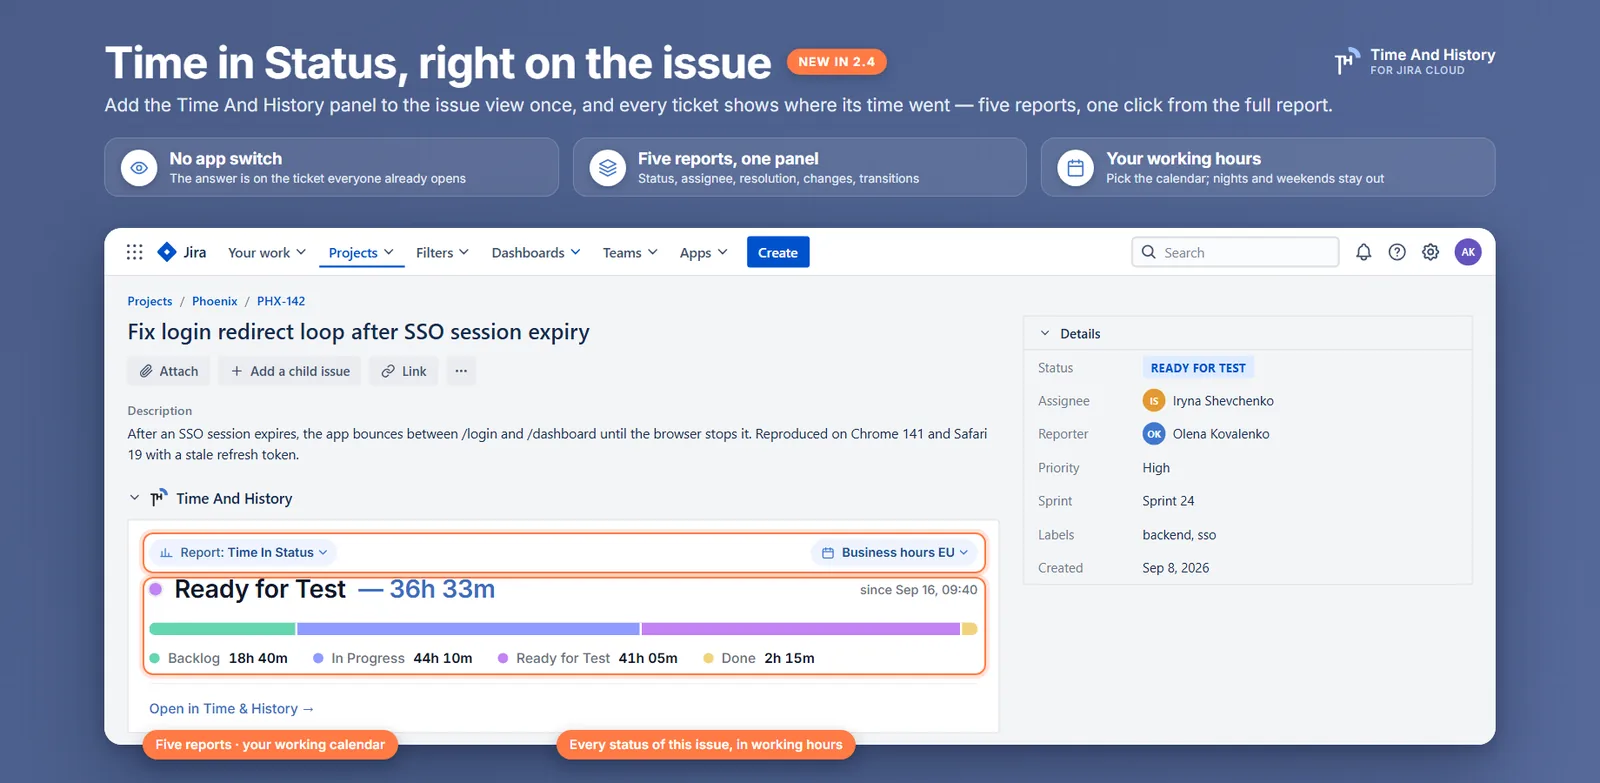
The question is small and it recurs constantly, which is the worst combination a workflow can have. Time in status on a Jira issue is not a field Jira stores — it records the moment each status changed and nothing else, so the duration only exists once somebody computes it. The fix is to have it already computed, on the ticket, before anyone asks: Time And History adds a panel to the Jira issue view that shows the current status with its open time, a bar of every status the issue passed through, and a switch to four more reports for the same ticket.
What a Jira issue shows you, and what it withholds
The History tab is honest and complete: every status change, who made it, from what, to what, when. It is also the raw material, not the answer, and it has three frictions that never go away.
- The numbers are not there. You get two timestamps and a subtraction to do. The status change history post covers what the changelog does and does not record.
- Dates are relative by default. "Yesterday", "last week". Precise arithmetic starts with two hovers.
- Status changes share the tab with everything else — assignee moves, field edits, sprint changes — so on a long-lived issue you scroll before you can read.
And even after the arithmetic, the number is wall-clock. An issue that entered In Review at 16:50 on Friday has not been waiting "three days" by Monday morning in any sense a team would defend; it has been waiting about an hour of anyone's working time.
Add the Time And History panel to the issue view
The panel does not appear on its own — you add it from the issue's Apps menu, once per issue.
- Open any Jira issue.
- Use the issue's Apps menu — the Apps button in the issue's action row — and pick Time And History. Jira adds the panel as a collapsible section under the description.
- That is the whole setup. Adding the panel is per issue and applies to everyone who opens that issue; on another issue, add it again from the Apps menu. There is no admin step, no new permission prompt and nothing for a project lead to configure — the panel only reads.
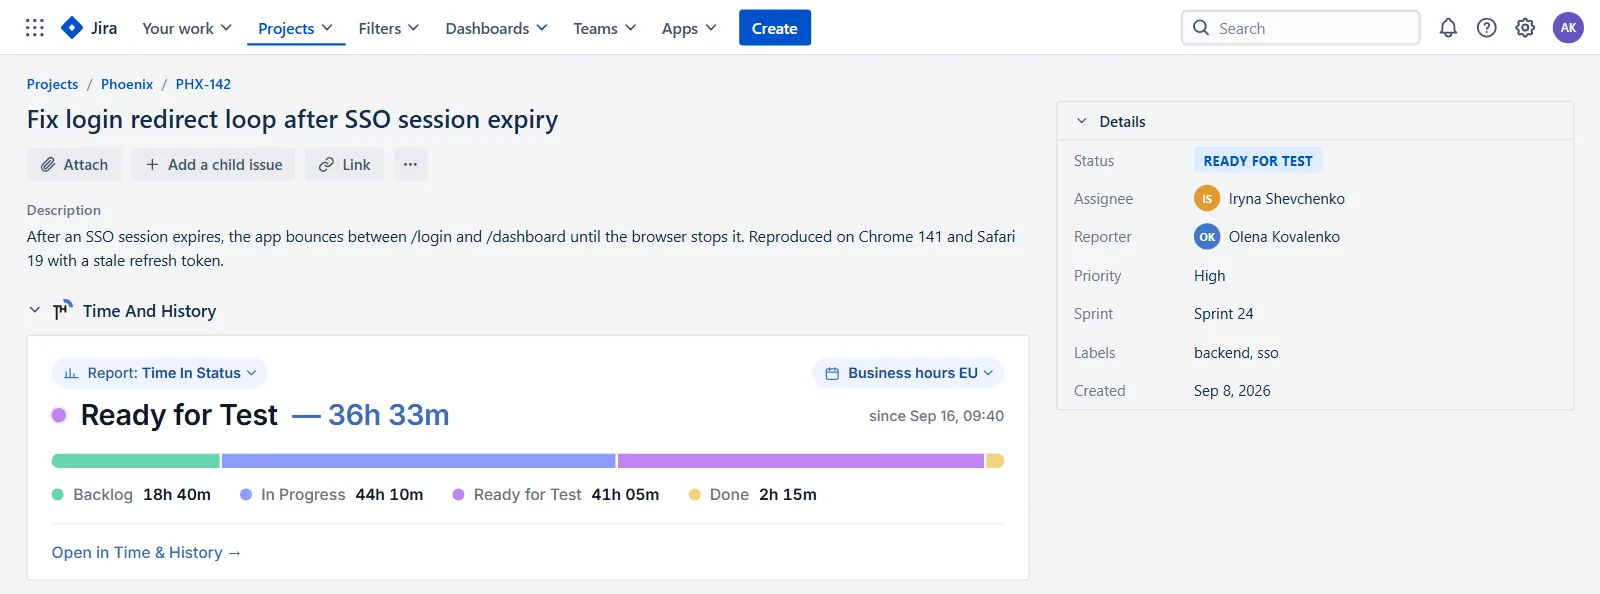
- Read it. The headline is the status the issue is in right now and how long it has been there. Under it, a segmented bar and a legend give the working time in every status the issue has passed through.
Reading the panel: the open stay and the total are different numbers
This is the detail that makes the panel trustworthy, and it is worth thirty seconds of attention.
The headline — Ready for Test — 36h 33m, since Sep 16, 09:40 — is the current stay: working time since the issue most recently entered that status. The legend row for the same status is the cumulative time: every stay in it added up. On an issue that went round the loop once, the two disagree, and they should. A ticket that spent 12 hours in Ready for Test in week one, went back to In Progress, and returned four hours ago has a legend reading 16h and a headline reading 4h. Both are true; they answer different questions.
Two more rules behind the numbers:
- The statuses are listed in the order the issue met them, not sorted by size. The bar is the ticket's story left to right, which is why a status can appear before a shorter one above it in the legend.
- Everything is working time. A status entered at 20:00 on a Friday reads
0h 0mon Saturday morning, because no working time has passed. An issue that has genuinely accrued none yet says so in a muted line rather than drawing an empty bar.
Five reports on the same ticket
The caption row carries a Report: chip. It switches the panel between all five reports, for this one issue:
- Time in Status — the default: current status, bar and legend as above.
- Assignee Time — how long each person held the issue, with Unassigned drawn muted in its own segment, and the current assignee's open stay as the headline. Useful the moment a hand-off is the suspect.
- Time to Resolution — created-to-done in working hours, with the resolution passes broken out when the issue was reopened. An unresolved issue reads Open with the working time since creation, and says plainly that no resolution is set rather than inventing a number.
- Time in Changes — one row per field that changed on this issue, with how many times it changed and how long the current value has held. Fields follow your History by Fields selection on the report, so it lists what you actually track, including custom fields such as Story Points.
- Transition Count — the status pairs this issue produced, as counts: Ready for Test → In Progress ×3. The calendar pill turns into flat text here, because counts are counts — no working-hours clock applies to them. The Transition Count report explains what the number is good for.
Your choice of report is remembered, so if your team's question is usually "who had it", the panel opens on Assignee Time from then on. Longer lists are capped at five rows with a +N more line — the panel is a summary that fits in a Jira column, not a report page in miniature.
The calendar the panel counts with
Next to the report chip is a calendar pill. It selects the work calendar — business days, hours per day, time zone, holidays — that the panel's durations are measured against, and it writes the same setting as the Working hours control on the report page. Change it here and the full report agrees; change it there and the panel agrees. The two cannot disagree.
If your site has a single calendar, the pill renders as plain text with nothing to click.
From one ticket to the whole filter
At the foot of the panel is Open in Time & History →. It opens the full report already scoped to this issue, so you land on the same number in a place where you can widen it: swap the scope for the epic, the sprint or a JQL query, and the single-ticket suspicion becomes a pattern you can show someone. That is usually the real sequence — one ticket raises the question, the report answers whether it is a ticket problem or a workflow problem.
Where the panel stops
Four limits, stated up front rather than discovered in a meeting.
- It is one issue. Averages, medians, footers and comparisons live on the report page; the panel deliberately shows no aggregate, because an average of one issue is a number begging to be misread.
- It is not a dashboard gadget. The eight gadgets cover four of the five reports and sit on a dashboard; the panel sits on a ticket. Which one you want depends on whether the audience is looking at a board or at a wall.
- It shows, it never writes. Nothing in the panel changes the issue, adds a field or posts a comment. It reads the changelog Jira already keeps.
- Permissions are Jira's. The panel reads the issue as the person looking at it, so someone who cannot open the issue cannot read its history through the panel either. On an issue you lack permission for, it says so instead of showing an empty chart.
Time in status on a Jira issue FAQ
How do I see how long a Jira issue has been in its current status?
Natively: open the issue, go to Activity → History, find the row where the status changed to its current value, hover the relative date for the exact timestamp and subtract it from now — that gives you wall-clock time. With the Time And History panel added from the issue's Apps menu, the number is already on the ticket, in working hours against your work calendar, with the date it entered the status printed beside it.
Can Jira show time in status on the issue itself?
Not out of the box. Jira records status changes in the changelog and shows them in the History tab, but it stores no duration and renders no per-status total on the issue view. A Time in Status report computes it from that changelog, and the issue panel puts the result back on the ticket where the question gets asked.
Why does the panel show a different number than the History tab?
Because the panel counts working time and the History tab implies wall-clock time. An issue that entered a status at 16:50 on Friday shows roughly one working hour by Monday at 09:50, not three days. The panel has no wall-clock mode: raw elapsed time lives in the History tab timestamps, and the number your team would defend in a review is the one on the panel, counted against your real business hours.
Does the panel need an admin to enable it?
No. Anyone who can open the issue adds it from the issue's Apps menu, and it stays on that issue. It needs no new Jira permissions, because it reads only the issue and its changelog — the access the app already has — so nobody is prompted to re-consent.
Do my teammates see the panel too?
Yes, on that issue. Adding the panel from the Apps menu stores it on the issue itself, so everyone who opens that issue sees the section — each person reading it with their own Jira permissions, their own report choice and their own calendar. It is not added to other issues; add it there from the Apps menu when you need it.
Does the current status time match the legend?
Only on an issue that entered the status once. The headline is the current stay, measured from the most recent entry into that status; the legend row is the cumulative time across every stay. On a reopened or bounced-back ticket the legend is larger, and the gap between the two is what the loop cost.
Is the issue panel included in the free plan?
Yes. Time And History is free for Jira sites with up to 10 users, with the issue panel, all five reports, exports and scheduled reports included; larger sites are on the paid plan, which starts with a free trial from the Marketplace listing. Checked 20 September 2026 — the listing carries the current terms.
Put the answer where the question is asked
Open the ticket that came up in your last standup and add the panel from its Apps menu. Read the headline, then look at the legend beside it: if the two numbers are far apart, that ticket has been round the loop and the interesting conversation is about rework, not about this week.
The panel is part of Time And History for Jira Cloud — five reports built from the issue history Jira already keeps, all counted in business hours against your work calendar, on the issue view, on a dashboard, in the report page or by email. Install it from the Atlassian Marketplace — free for up to 10 users, so one team can try it without a purchase order. The issue panel documentation has the rest of the rules, and the Time in Status report guide explains how the numbers on the panel are calculated. Verified 20 September 2026.