
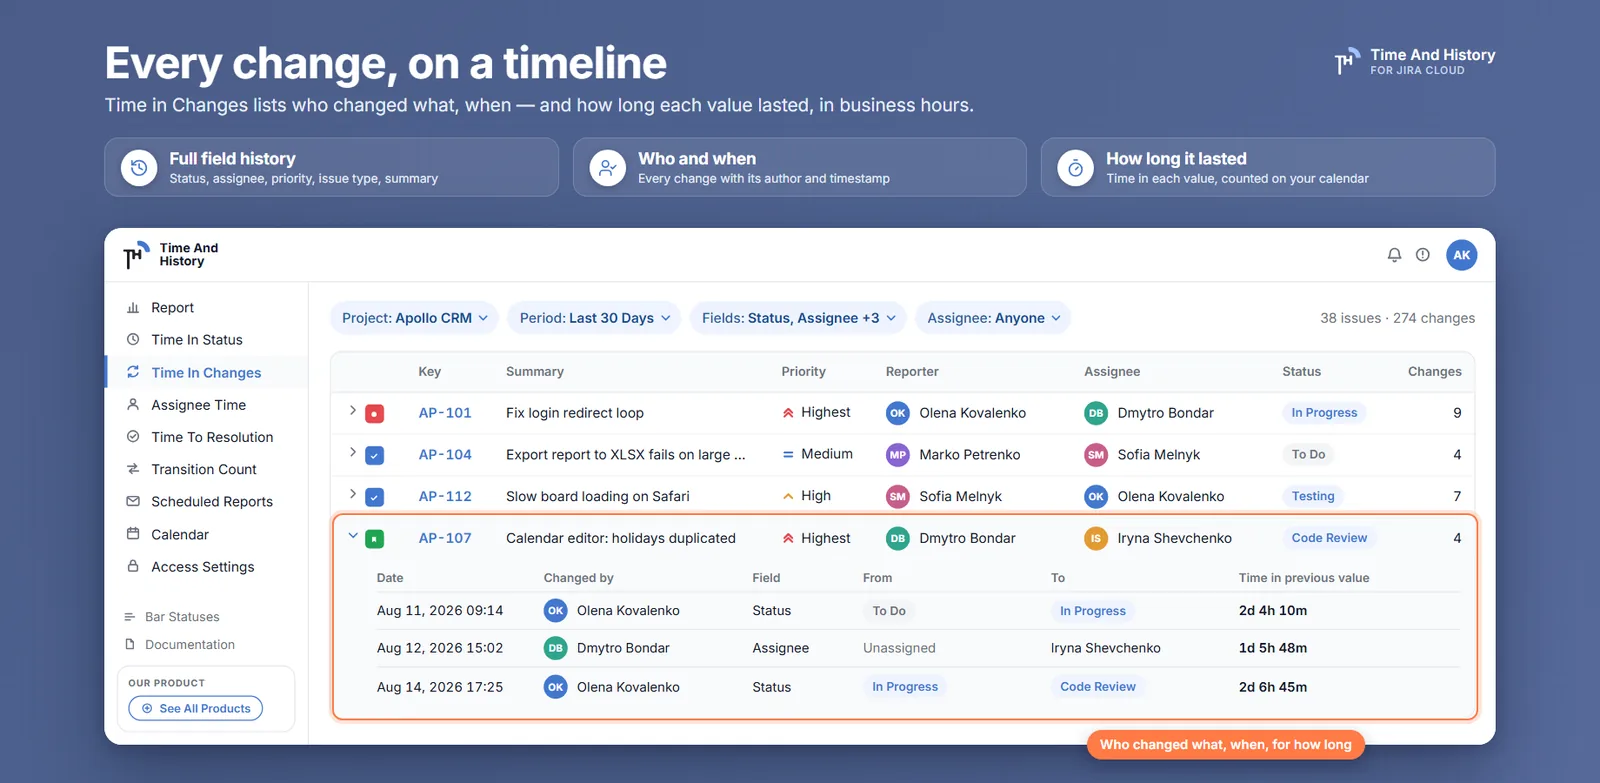
A ticket goes out in the release, a customer finds it broken, and the question in the channel is who moved it to Done on Friday afternoon and why nobody tested it. The Jira status change history has that answer exactly — every field change is recorded with an author and a timestamp, and none of it is guesswork — but Jira hands it back one issue at a time, in a feed of relative timestamps with no durations in it at all. The short answer: open the issue, scroll to Activity, switch the tab to History, and the row reading Status: In Review → Done carries the name and the timestamp. Ask the same question across a sprint, or ask how long the old value lasted rather than when it changed, and the changelog has to be read as a report instead of as a feed. This covers what the History tab answers and the four places it stops, how a change row is built, and one piece of arithmetic that tells you whether the durations in front of you are complete.
Where the Jira changelog lives, and where the History tab stops
Underneath every issue sits an append-only record called the Jira changelog. Each save writes one entry — an author, a timestamp, and one item per field that changed, with the value before and the value after. Edit three fields on one screen and you get one entry carrying three items under one name and one moment. Values are frozen as they were written, so renaming a status later leaves the old rows reading the old name, which is exactly what you want from a historical record. The record covers writes and only writes — no views, no searches, no exports — and a description change is stored as the old text and the new text, two blobs rather than a diff, so the comparison is your job.
The History tab on an issue is a rendering of that record, and for one issue and one question it is the right answer — reaching for anything else is overkill. It stops in four places, and they arrive faster than most teams expect.
- One issue at a time. There is no cross-issue form. "Who moved this to Done" scales to "who moved these forty to Done" by opening forty tabs. Nothing native lists changes across a project, a sprint or a filter.
- Timestamps, not durations. Jira stores the moments at which a value changed, never how long it was held. The gap between two rows — usually the number you actually came for — exists only once something computes it, and the tab does not.
- Long histories are archaeology. Status rows are interleaved with every other field change, and there is no per-field filter. An issue reassigned nine times and moved between sprints buries its six status transitions under a hundred rows of everything else.
- No export, and not quite complete. There is no download button, so anything leaving Jira leaves by screenshot or by hand — and Atlassian documents cases where the History tab omits changes for some fields that do exist in the underlying record. When the tab and the record disagree, the record is the arbiter.
None of that is a defect. The tab is an activity feed for one issue, and a good one. It was never meant to be a report. What Jira does give you instead — four native routes, and what each one is actually for — is below, once the rows are on screen.
How to read the Jira status change history across a filter, step by step
There is no separate history report to go and find in Jira, so this is the part an app does. In Time And History it is Time in Changes, the report that treats the changelog as data rather than as a feed, and setting it up is a minute of work you do once.
- Open the report. From the Jira top bar, Apps → Time And History, then Time in Changes. The table lists issues, one row each, with a Total Time From Created column on the end.
- Describe the issues you mean. Project, epic, sprint, reporter and assignee sit along the top, with a date range beside the export button. This is the cross-issue form the History tab does not have: a sprint, an epic, or everything one person reported last month.
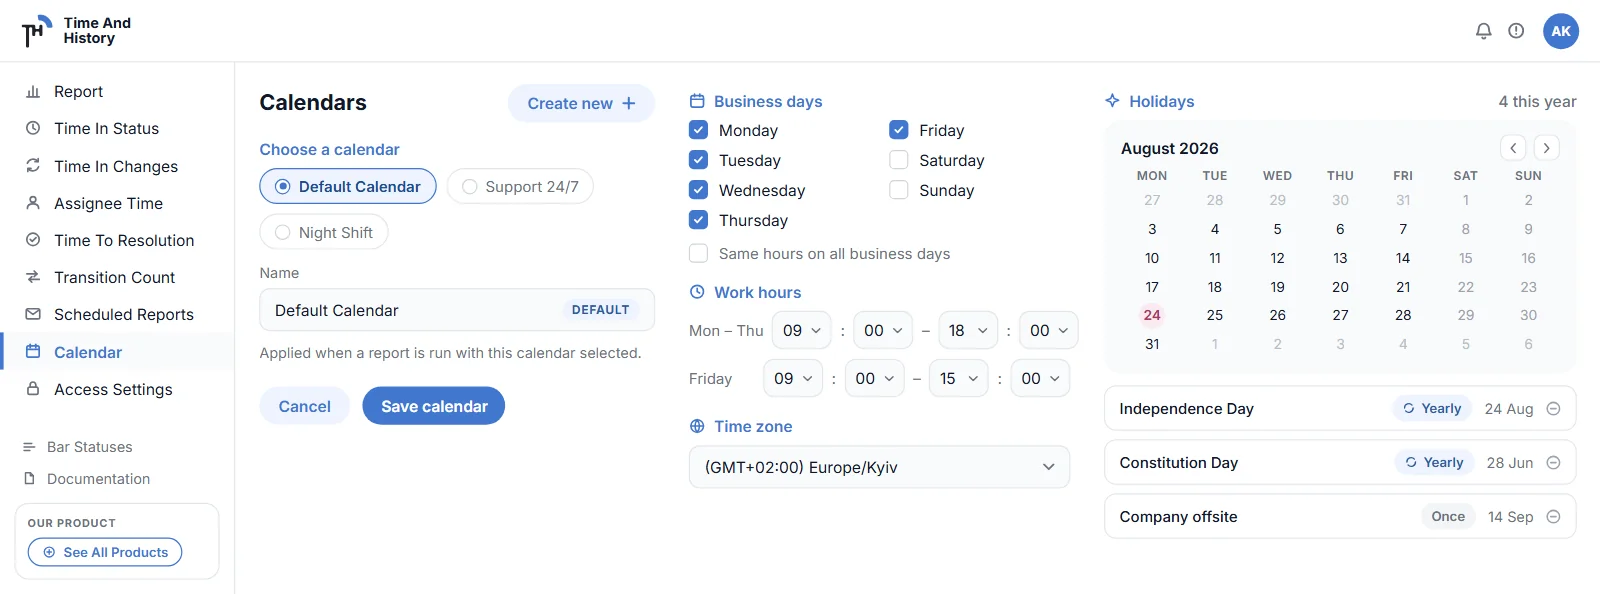
- Set the work calendar and the time format before you read anything. The calendar — business days, working hours, time zone, holidays — decides what an hour means here, and every duration on the report is computed against it. The format is a display choice over that same number rather than a second clock:
HM,DHM, decimal hours or decimal days, and inDHMa "day" is 24 of those working hours, not one working day. - Choose your fields in History by Fields. This report has no Columns selector; History by Fields stands where Columns stands on the other reports. Open it, search the list, toggle what you want and press Save — Cancel discards the draft and changes nothing. The report reads the fields Jira records in the changelog — the standard ones (status, assignee, priority, reporter, issue type, summary, description, labels, due date, resolution) and, since 2.4.0, custom fields such as Story Points. One thing worth knowing before you press Save: this is the same per-user set that the Columns selector writes, so trimming it here trims the columns on Time in Status, Assignee Time, Time to Resolution and Transition Count for you too — and for nobody else.
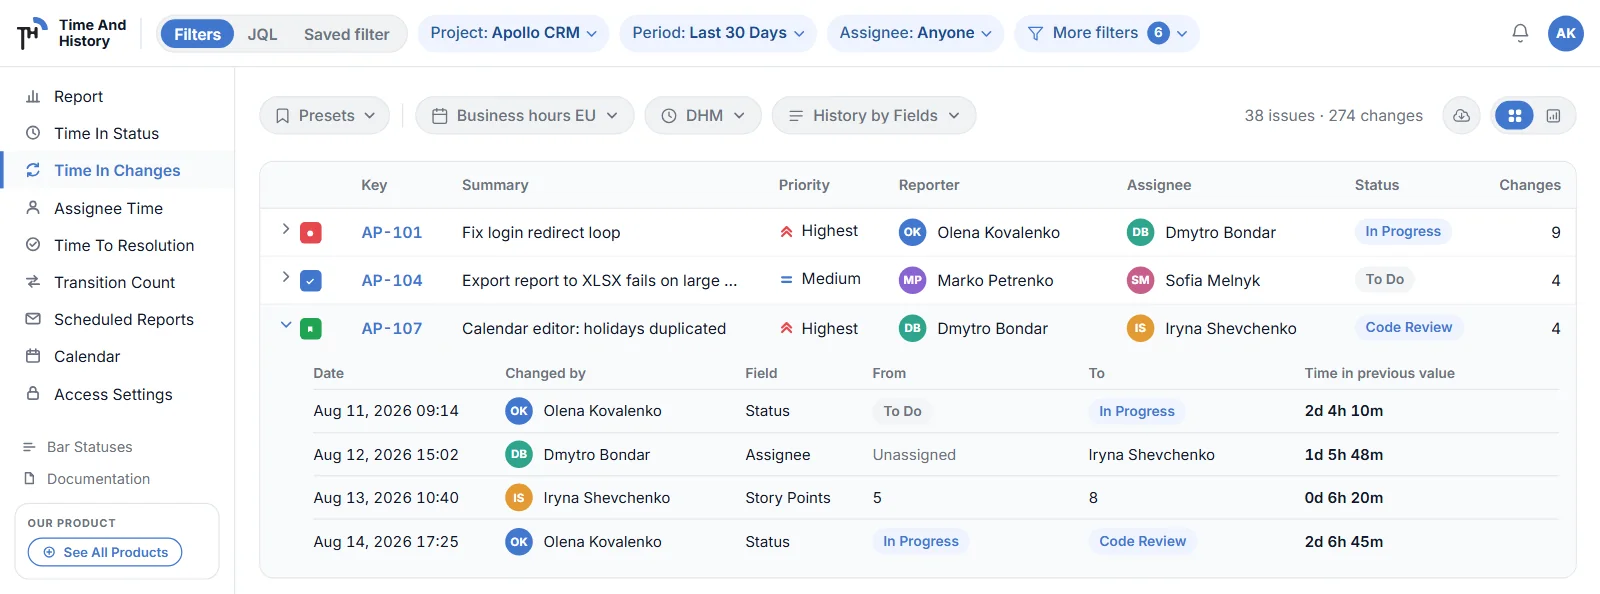
- Expand an issue. Click the row or its chevron and the issue's history opens underneath it, one table, ordered by field group and oldest to newest inside each. That is where "who moved it, and when" stops being a question and becomes a row.
- Do nothing next time. The selection is saved for you on that Jira site and comes back next session and in another browser. There is no rule to keep running, no helper field to protect through the next workflow edit and nobody to hand it to when you go on leave. And it reads history Jira already stored, so the sprint you are arguing about is on screen the first time you open the report — not a quarter after somebody switches something on. It is personal, too — two people can track different fields on the same project and both tables are right.
Reading a change row: who, when, and how long the old value lasted
The drill-down is six columns — Date, Changed By, Field, Old Value, New Value, Time In Old Value — and five of them read the way you would expect. The sixth is the one that turns a log into an answer, and it points backwards: Time In Old Value is the working time the value in the Old Value cell was held, right up to the moment on this row. The row is not about the change; it is about the value the change ended.
Two rules make the column complete, and neither is obvious from looking at it.
The first row of each field starts at issue creation. Jira writes no changelog entry for the create transition, so the issue's first status has no "from" row to be measured against. The report measures it from the issue's creation timestamp instead — which is why the first value gets a duration at all, and why a tool that subtracts consecutive changelog rows loses it silently.
The last row is the value that is still running. Each field group ends with a synthetic row whose Old Value cell holds today's value and whose New Value cell reads Same as old value. That row is not a change, whatever its first two cells look like: Changed By repeats whoever made the last real change, and Date is the moment you opened the drill-down — nobody changed anything then. Its duration is the working time since the last change — "how long has this been sitting where it is now", answered continuously instead of waiting for the next transition to close the interval.
Here is PROJ-231's status history as the drill-down renders it. The issue was created at 14:20 on Monday 2 March, the calendar is Monday to Friday, 09:00–17:00, and the report was opened at 09:40 on Tuesday 10 March.
| Date | Changed By | Field | Old Value | New Value | Time In Old Value |
|---|---|---|---|---|---|
| 3 Mar, 10:50 | Anna K. | Status | To Do | In Progress | 4h 30m |
| 4 Mar, 15:20 | Anna K. | Status | In Progress | In Review | 12h 30m |
| 6 Mar, 18:05 | Pavlo D. | Status | In Review | In Progress | 17h 40m |
| 6 Mar, 18:20 | Anna K. | Status | In Progress | In Review | 0h 0m |
| 9 Mar, 11:40 | Pavlo D. | Status | In Review | Done | 2h 40m |
| 10 Mar, 09:40 | Pavlo D. | Status | Done | Same as old value | 6h 0m |
Six rows carry the whole story, names included: Pavlo bounced it out of review late on Friday, Anna pushed the fix fifteen minutes later, and the second review passed on Monday morning. Three readings in that block are worth taking deliberately, because each is a place where somebody quotes a history wrongly.
The column adds up to the row you expanded. Add the durations: 4h 30m + 12h 30m + 17h 40m + 0 + 2h 40m + 6h 0m = 43h 20m — and 43h 20m is exactly what the Total Time From Created cell on PROJ-231's own row reads. That is not a coincidence and it is not a rounding accident. The intervals tile end to end with no gaps: the first starts at creation, each one after starts where the previous change landed, and the last ends at the moment the drill-down was fetched — so the two agree to within whatever working time passed between the table loading and your expanding the row. Reload before you compare if the report has been open a while. It is the check to run before you quote any of this, because a history with a page missing still looks perfectly plausible — the sum comes up short. Select several fields and each group sums to that same total independently, which is a second way of asking the same question.
A zero is a reading; "No Data" is not. The fourth row shows 0h 0m because the value really was held for no working time: Anna changed it back at 18:20 on a Friday, fifteen wall-clock minutes after 18:05, with a working day that ended at 17:00 — so the whole interval fell outside the calendar. A genuine zero is formatted like every other duration here, and No Data is reserved for a row with no number at all. The distinction is the same discipline as a dash is not a zero on the status columns: one says nothing happened, the other says nothing was measured, and reading either as the other is how a summary goes quietly wrong.
The clock is your work calendar. The fifth row spans Friday 18:20 to Monday 11:40 — 65 hours and 20 minutes of wall-clock time, and 2h 40m of it on this calendar, because the weekend counted for nothing and Friday was already over. Change the calendar and every duration in the drill-down changes with it; what a work calendar changes in your numbers works one interval through both clocks. The comparison rule is the usual one: same filter, same calendar, or the two readings are about different things.
A change history answers one question precisely and several others badly, so it helps to know where each of the neighbours lives. How much time an issue spent in each status, summed across visits, is the Time in Status report. How many times it looped is Transition Count, which counts status pairs rather than reading them. How long each person held it, totalled per person rather than listed per handover, is Assignee Time. The drill-down is the narrative; those three are the arithmetic over it. The traffic runs the other way too, and more often than the incident does: when a status total on Time in Status looks wrong, expanding that issue here is where the rows that produced the number are.
Four questions to ask any tool that shows you a change history
Every tool in this category will show you a list of changes. The list is not the product; knowing it is complete is. Before you standardise on one, open it and check:
- Does it read the whole changelog, or the first page? Jira returns changelogs in pages of at most 100 entries, and the convenient call —
expand=changelogon the issue endpoint — stops at that boundary without saying so. An issue with 100 changes is not exotic. A tool that stops there computes from a history missing its beginning, and the result looks fine. Here the drill-down asks Jira for the next changelog page until there is none left, so the top row is the issue's first change rather than the hundredth from the end. - Does the first interval start at issue creation? There is no changelog entry for the create transition, so a tool that pairs consecutive rows has no duration at all for the value the issue started with — usually To Do, usually the one somebody is asking about. Here the first row of each field is measured from the issue's creation timestamp, which is why it carries a duration at all.
- Does a zero read as a zero? Two values changed inside the same minute, or an interval that fell entirely outside working hours, is a real reading of nothing. Showing it as missing data hides a rapid reversal, which is often the interesting row on the page. Here a genuine zero is formatted like every other duration, and No Data is kept for a row carrying no number at all.
- Is there a name on the row? A history without an author is a log — you can see that something moved and never who moved it. Here every change row carries its Changed By name, which is what makes the sequence checkable instead of a claim about it.
If somebody has already asked you who moved a ticket to Done — and they will — expanding one issue on last week's sprint is about a minute of work, not a project. Time And History is free for up to 10 users.
Four native routes, and what each one is actually for
One question arrives as soon as the rows are on screen: could Jira have done this? Four native routes get partway, and two of them are regularly asked to do a job they cannot do.
JQL history operators find issues, not changes. status CHANGED FROM "In Review" TO "Done" AFTER -7d is a genuinely useful filter, and the operator list is worth learning. What comes back is a list of issue keys. Which person moved each one, at what minute, and what the status was before — those rows still live one History tab at a time.
The audit log is a different record entirely. This is the route people ask for by name and the one most often misunderstood. Jira's audit log records administrative and configuration activity: permission scheme edits, workflow changes, custom field lifecycle, user management. It does not record issue field changes. A status transition, a priority flip, an assignee handover — none of them ever appear there, on any plan. When a compliance request asks for "the audit trail of this ticket", the artefact it means is the changelog.
A CSV or Excel export from issue search carries current values only. It answers "what do these issues look like now" across a whole project and contains no history of any kind: no column for who set a value, none for what it was before. An export taken weekly is stop-motion with a seven-day shutter, and everything between frames is gone.
The changelog REST API is the complete answer at the wrong altitude. GET /rest/api/3/issue/{key}/changelog returns the true record, paginated at 100 entries per page. It is per-issue, so anything cross-project means enumerating issues first and walking each changelog; durations mean pairing rows and doing calendar arithmetic yourself. It is the right foundation and an unreasonable place to stop if what you needed was an answer by Thursday — and the script that gets you the rest of the way is the thing somebody now owns.
The dashboard is not a fifth route. Jira's stock gadgets aggregate — issue counts, filter results, an average over a window — and not one of them renders a changelog row with a name on it. Native behaviour verified 2026-09-07.
Getting the change history out of Jira — and what stays on screen
Three routes lead off the report, and it is worth being precise about what each one carries.
The export carries every issue the filter matches. Set your filters, open Export, pick XLSX or CSV, and the file arrives with a row per issue — Issue Key, Issue Type, Priority, Summary, Assignee, Status, Reporter and Total Time From Created — over the whole selection rather than the page you were reading. What it hands over is which issues, and how long each has been alive on your calendar; the per-change rows stay on screen. If what you need in a workbook is per-issue durations, the export walkthrough covers the mechanics and exporting the full list of formats. A scheduled report mails the same XLSX daily, weekly or monthly.
Chart mode counts instead of listing. Switch it on and the report draws changes per field — a bar chart by default, with donut and area available, and bar and area grouping by day, week, month, quarter, year or Auto. Four KPI tiles sit above both modes: Total changes, Issues tracked, Fields and Avg changes per issue. Read the caption before quoting any of them — above the table it says This page, in chart mode Whole selection, and those are different populations. Fields is the one tile that reads the same in both, because it counts the fields you selected rather than the fields that happened to change.
The gadget carries the count, not the rows. Time in Changes ships as a dashboard gadget in two forms, a chart and a table, which is how the count of changes per field reaches people who never open the app. The change rows themselves stay on the report page.
Where Time in Changes is the wrong tool — and what to use instead
Three limits, because a report you have to caveat in the meeting is worse than one you understood beforehand.
- The detail is still one issue at a time. The table spans the whole filter, which is the part the History tab cannot do — but the change rows appear inside an expanded row. There is no flat "every change in the sprint, one row each" view on screen. To scan forty issues' reopens you expand forty rows, or you switch to chart mode and read the counts instead of the narrative.
- No Avg, Median, Min or Max. This report has no statistical footer; it gives you counts and per-change durations. The four summary numbers per status, with the distribution reading that goes with them, live on Time in Status — what the mean hides in a Jira average is the guide to using them without getting caught out.
- The date range picks issues, not changes. Expand an issue and you get its history for the selected fields whenever those changes happened, not only the ones inside your window; the same is true of the Total changes tile. That is what you want when you are reconstructing a story, and misleading if you read a filter labelled September as "the changes made in September". The window chooses which issues are on the report.
Jira status change history FAQ
How do I see who moved a ticket to Done in Jira?
Open the ticket, scroll to the Activity section and switch the tab to History. Find the row where Status changed to Done: the author's name and avatar are on that row, with a timestamp — hover the relative label to get the exact minute, because "last week" drifts in retellings. For the same question across many tickets, Time in Changes filters to a project, epic or sprint and every issue expands into its changelog, with the Changed By name on each row.
How long did a Jira issue stay in a status before it changed?
That is the Time In Old Value column, and it points backwards: it is the working time the value in the Old Value cell was held, ending at this row's timestamp. The first row of each field is measured from the issue's creation, because Jira records no changelog entry for the create transition. The last row of each field is the value still in force, with the working time since the last change — so an open issue tells you how long it has been sitting where it is, without waiting for the next transition.
Does Time in Changes track custom fields?
Yes, since 2.4.0: Story Points and any other custom field Jira records in the changelog, plus attachment, fix versions and components, alongside the standard fields (status, assignee, priority, reporter, issue type, summary, description, labels, due date and resolution). Pick them in History by Fields; a few changelog entries that carry no field id, such as worklog ids and Epic Child, stay out of the list. Jira custom field history works Story Points through end to end.
Can I export Jira status change history?
Yes, as an issue table. The XLSX and CSV exports from Time in Changes carry Issue Key, Issue Type, Priority, Summary, Assignee, Status, Reporter and Total Time From Created across every issue the filter matches rather than the page you were reading, and a scheduled report mails the same workbook daily, weekly or monthly to the people who asked. The per-change drill-down stays on screen; for a count of changes per field that leaves the page, chart mode and the KPI tiles are the route, and the Time in Changes gadget puts that count on a dashboard.
Why does a change show 0 rather than No Data?
Because zero is a real answer. A value replaced within the same minute, or one whose whole interval fell outside your working calendar — set at 18:05 on a Friday and changed at 18:20 — was genuinely held for no working time, and it is formatted like any other duration. No Data is kept for a row that carries no number at all. Reading a zero as missing data hides exactly the rapid reversals worth noticing.
Does my History by Fields selection change what my teammates see?
No. The selection is saved per user on that Jira site, so it comes back next session and in another browser, and nobody else's report moves when you press Save. Two people can read the same project tracking different fields and both drill-downs are correct.
What does this cost?
Time And History is free for Jira sites with up to 10 users — Time in Changes, its dashboard gadget, chart mode, exports and scheduled reports all included, with no separate tier for any of them. Larger sites are on the paid plan, which starts with a free trial from the Marketplace listing; the reports behave identically on both. Checked 7 September 2026 — the listing has the current terms.
Read one issue end to end on last week's sprint
Take the ticket your team argued about — the one that went to Done and came back — filter Time in Changes to that sprint, select Status and Assignee in History by Fields, and expand it while the table is fresh. Then do the arithmetic in the last column and check the sum against the Total Time From Created cell on the issue's own row. If the two agree — to within the working time that passed while you were reading — the history in front of you is complete from creation to now, and every change row has a name on it. That is a five-minute exercise, and it replaces "somebody moved it early" with a timestamp, a person and the number of working hours the wrong value stood.
Time in Changes is one of five reports in Time And History for Jira Cloud — Time in Status, Assignee Time and Time to Resolution are the others, all counted in business hours against your work calendar, plus Transition Count, which counts status changes rather than hours. Install it from the Atlassian Marketplace and expand the issue you argued about last sprint — free for up to 10 users, so the first team can try it without a purchase order. The Time in Changes documentation has the rest of the rules. Verified 7 September 2026; custom-field support updated 26 September 2026.