
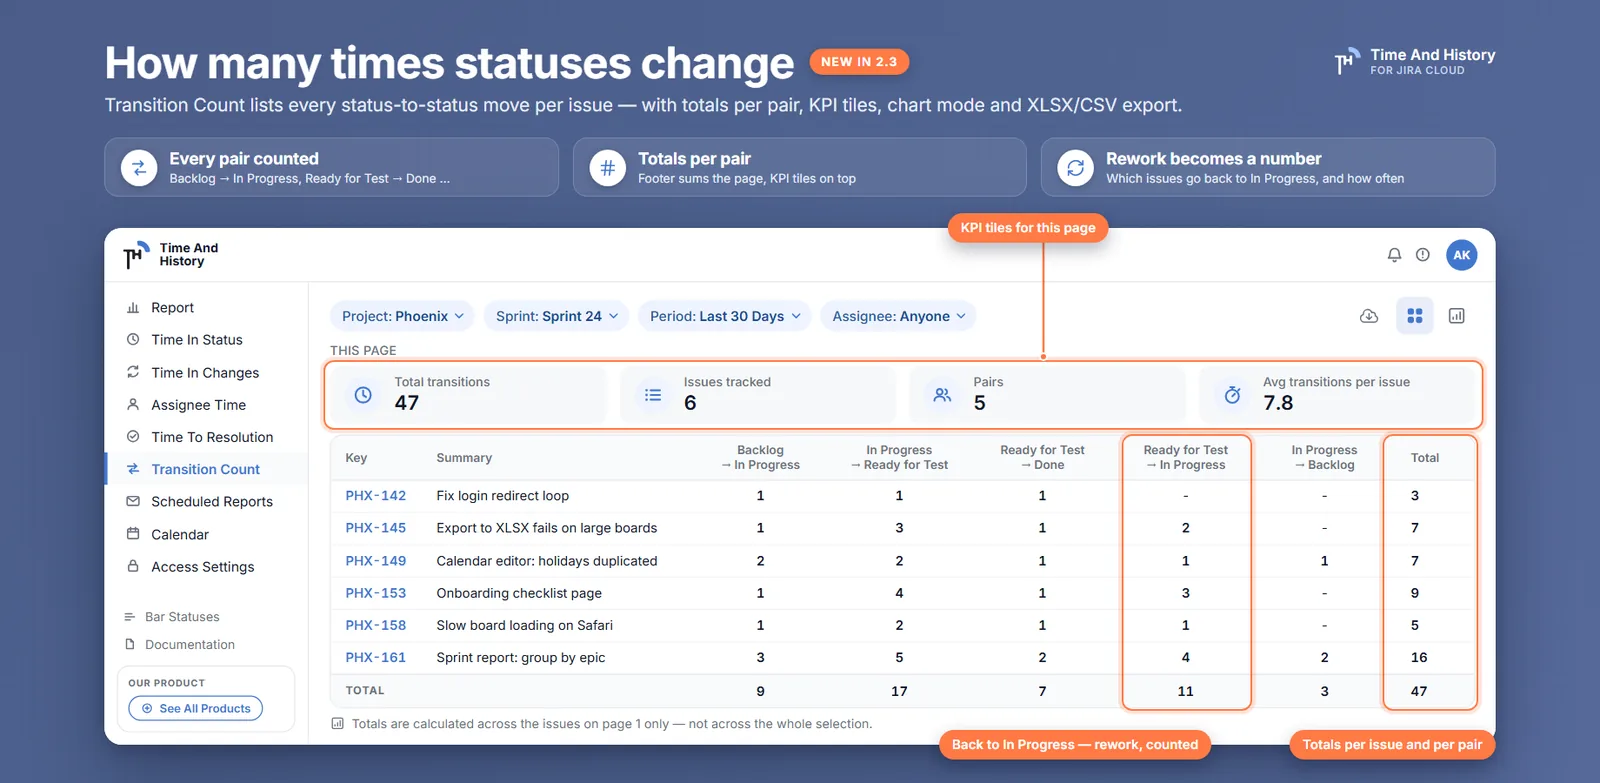
In sprint review somebody says the same tickets keep coming back, the room agrees, and nothing changes — because "keeps coming back" is not a number and nobody can put one beside it. A Jira transition count report is what turns it into one: for every issue, how many times each status pair occurred, so Done → In Progress: 3 stops being an impression and becomes a cell you can point at. Jira has recorded every one of those moves since the day the project was created; it has never added them up.
The short answer: the issue changelog is the only place a status change is stored, and nothing in Jira aggregates it, so the count exists only once something walks that changelog and tallies each from → to pair per issue. The arithmetic is trivial. What is not trivial is everything wrapped around it, and that is where this number gets quoted wrongly in meetings: what your date filter actually selects, what a blank cell means, which issues the totals underneath cover, and why the columns sit in the order they do. This covers all four, on a worked page you can add up yourself.
Why Jira cannot tell you how many times an issue changed status
Open any issue and click History. Every status change is there — an author, a timestamp, an old value, a new value — and that list is the entire record. Jira stores no counter, no "times reopened" field, and no report that adds the list up across issues. Three properties of the changelog explain why counting rework in Jira is harder than the subtraction it looks like.
- It is per issue, and only per issue. The History tab answers "what happened to this ticket". There is no view that opens the same list for a sprint's worth of tickets side by side, so the question "how many of these went back to In Progress" is answered by opening thirty tabs and counting by eye.
- It is an activity feed, not a table. Status changes are interleaved with reassignments, priority edits, summary tweaks and every automation that ever touched the issue. On a long-lived ticket — and the reopened ones are disproportionately long-lived — the four moves you care about are scattered through sixty rows you do not.
- The stock dashboard gadgets chart issues, not events. Jira's built-in gadgets group issues by a current field value — status, assignee, priority — or by created and resolved dates, and the one gadget that does look at statuses reports a duration rather than a count. An issue is one issue in every one of them, whether it went round the workflow once or five times. The looping is exactly the thing they average away.
So the raw material is complete and the reporting is absent — which is a reporting problem, not a data problem, and the difference is why last quarter is answerable this afternoon.
How to run a Jira transition count report, step by step
In Time And History the way to count status transitions is a report of its own rather than a column bolted onto another one, and getting to the numbers takes about a minute.
- Open the report. From the Jira top bar, Apps → Time And History, then Transition Count in the report list. It is the fifth report, and the only one that counts events instead of measuring time.
- Set the filters. Project, epic, sprint, reporter, assignee and a date range — the same set as the other four reports, with the same Columns selector for the Jira fields that lead the table. Read the next section before you trust the date range: it selects issues, not transitions.
- Nothing to configure. No work calendar and no time format: a transition is a whole number, and business hours cannot move it, so the calendar settings do not touch a single value in this table. There is nothing to agree on before anyone reads the page, and nothing for anyone to own or hand over when they go on leave.
- Read the header before the rows. One column appears per status pair that occurred on the issues in front of you, headed with the pair — In Review → In Progress; pairs your workflow never walked do not become empty columns. The header only grows: page through the filter and a column it has shown once stays for the rest of the session, so a pair that first occurs on page three joins the header when you get there. Chart mode and the export work from the whole selection instead.
- Read across a row, then down the Total column. Each cell is how many times that issue made that move; the Total column is every transition counted on the issue.
- Read the TOTAL row, and the line under it. The footer sums each pair column, and the app states in words which issues it covers — the page you are on, not the whole selection. Chart mode and an export are how you get the wide view; both are below.
How to read a Jira transition count: which reopens it covers, and where they cluster
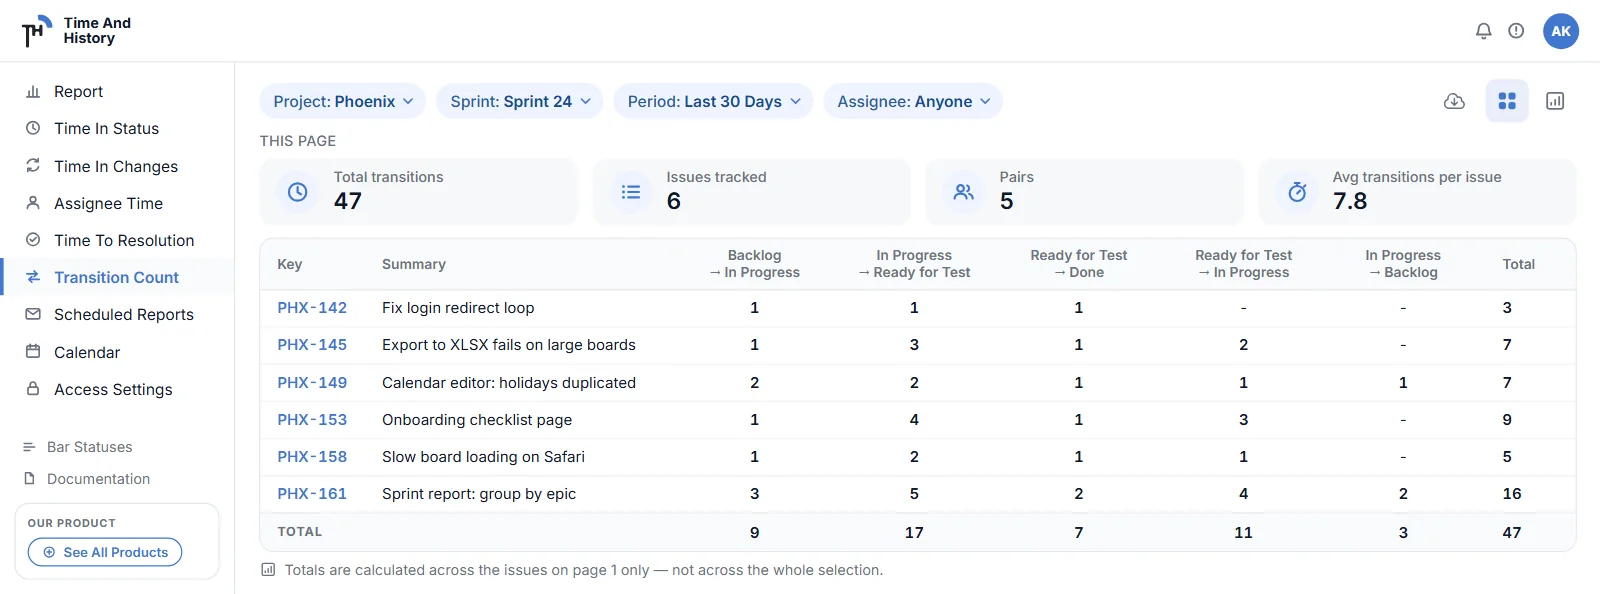
Here is one page of a Transition Count table, filtered to a project and a sprint. Five issues, five pairs, and every number below is checkable against the ones beside it.
| Key | To Do → In Progress | In Progress → In Review | In Review → In Progress | In Review → Done | Done → In Progress | Total |
|---|---|---|---|---|---|---|
| PROJ-401 | 1 | 1 | - | 1 | - | 3 |
| PROJ-404 | 1 | 2 | 1 | 1 | - | 5 |
| PROJ-409 | 1 | 3 | 1 | 2 | 1 | 8 |
| PROJ-413 | - | - | - | - | - | 0 |
| PROJ-415 | 1 | 1 | - | - | - | 2 |
| TOTAL | 4 | 7 | 2 | 4 | 1 | 18 |
One ticket is carrying the page. PROJ-401 went through once: started, went to review, was accepted. PROJ-409 is the one the retro is about — trace it and you get eight moves in order: into progress, to review, back to progress, to review again, to Done, reopened out of Done, to review a third time, accepted. Eight of the page's eighteen transitions are on that one issue: 44% of the churn on one ticket out of five, and 2.2 times the 3.6 average in the tile above the table. That is the reading worth taking into the retro, and both figures are checkable against the rows in front of you. The In Review → In Progress column is the work sent back before it was ever accepted; the Done → In Progress column is the reopen count. Three things in that block are worth reading deliberately, because each is a place the number gets misquoted.
The date range selected the issues, not the transitions. This is the caveat to carry into the meeting, and it is the opposite of what most people assume. Filtering to last sprint selects the issues that match last sprint; every transition those issues ever made is then counted, including the ones from three months earlier. The report never clips a changelog by event date, which makes the counts complete per issue and makes "reopens last sprint" the wrong sentence for them. The honest sentence for the page above is "the five issues this filter selected went back out of Done once between them, across their whole lives." If you need events confined to a window, chart mode is where to look: bar and area bucket each transition by its own timestamp, so a spike sits on the week it happened.
A dash is not a zero, and the two dashes are not the same dash. In a cell, a dash means the issue never made that move — a fact about the issue, printed in the same weight as a number rather than greyed out. PROJ-413's row is all dashes, and its Total still reads 0, because an issue that never moved really did make zero transitions; the Total column is never a dash. In the footer, a dash means something else entirely: that column's total for this page is unknown, which is not the same as zero, and it is drawn muted to say so. You will see it when a pair that appeared on page 1 does not occur on page 2 — the header keeps the column so the table does not reshuffle under you, and the footer declines to invent a number for it.
The header is ordered by workflow shape, then by frequency. Jira publishes no global ordering of statuses, so the report uses the only site-wide notion of "earlier" a status carries — its status category. Pairs are sorted by the category of the source, then of the target, then by how often they occurred. That is why To Do → In Progress leads and Done → In Progress ends the pairs on this page: a move that leaves a status in the done category sorts behind every move that leaves an earlier one, which is what puts the reopen column at the right-hand end. A send-back does not automatically go there. In Review → In Progress leaves an in-progress status, so it sits among the other moves out of that category, after In Progress → In Review (7 on this page) because frequency breaks the ties inside a category and its own 2 is the smaller number.
Above the table, four KPI tiles carry the same page scope, captioned This page: Total transitions 18, Issues tracked 5, Pairs 5, Avg transitions per issue 3.6. Note which population Issues tracked uses here — every row in the table, PROJ-413 included, because a row with a zero total is still a row. Switch to chart mode and all four recompute over the whole selection, with the caption changing to say so; the donut gives each pair its share, and bar — the default on this report — and area count transitions per period, grouped by day, week, month, quarter, year or Auto. That is the one place the work calendar reaches this report after all: the counts never move, but bar and area cut their day and week boundaries in the calendar's time zone, so a transition at 23:30 lands on the calendar's day rather than on UTC's.
A count answers one question well and three badly. How long the work actually took is Time in Status. How long from one named status to another is a Between Statuses column. Who made each move, and when, is Time in Changes. The count is the tally; those three are what it is a tally of — and all three are reports in the same app, on the same filters and the same licence, so following any of them is a click rather than a second purchase.
Four questions to ask any tool that counts transitions
Any report can hand you an integer. The integer is not the product; being able to defend it is. Before you standardise on one, open it and check:
- Does it tell you, on the page, whether the filter clipped the events or selected the issues? The two produce very different numbers from the same board, and the one that survives being quoted is the one that says which it did before somebody quotes it. Here the report says so in words: the date range selects issues, and then every transition those issues made is counted.
- Does a blank cell mean zero, or mean nothing happened? A tool that prints 0 for both has thrown away the distinction you need when someone asks which issues are in the total. Here a dash in a cell means the move never happened, a Total of 0 means the issue never moved, and a muted dash in the footer means that pair's total for this page is unknown.
- Does the summary say which issues it covers, on the summary itself? Here the caption reads This page or Whole selection, and the line under the table names the page, so the footer can be recomputed from the rows in front of you.
- What happens when a status is renamed? If the tool keys on names, next quarter you have two columns for one status and no way to add them up. Here the pairs are keyed by Jira's status id, so both names collapse into the one column that keeps adding up.
If your board has a PROJ-409 — and it does — that page takes about a minute to produce on the sprint that closed last week. Time And History is free for up to 10 users.
What Jira gives you without the app
Four native routes get partway, and it is worth knowing exactly where each one stops before you build a process on it.
JQL's CHANGED operator finds the issues: status CHANGED FROM "Done" TO "In Progress" AFTER -30d returns everything that went backwards along that edge, and a BY membersOf(...) predicate narrows it to who did it. It is a finder, not a counter: it returns issues, not events, so an issue that went back three times matches exactly as hard as one that went back once. What it hands you is the list to open one by one — the afternoon this report replaces. Each backward edge is its own clause, too, and the query grows every time the workflow does.
Atlassian's documented way to count them is an Automation rule: a number custom field, a trigger on the backward transition, and an Edit issue action that adds one. It is free and it works, and it starts at zero the day you switch it on: there is no backfill, and nothing about the field says it is undercounting. Two more limits sit on top of that. It counts only the edges named in the trigger, so a status added next quarter is silently not counted. And it is a bare integer: the field says 2 and cannot say from which status, when, or how the two compare.
The remaining two are familiar. The Control Chart plots elapsed time per issue between board columns — a duration view, not a count, and board-scoped. The changelog REST endpoint has everything, at the price of a request per issue, pagination to handle once a history runs long — which the reopened issues disproportionately do — and a script somebody now maintains.
The choice is sharper here than anywhere else in this app. A counter can only count forward, so the field it fills is silent about every reopen already sitting in your changelog — and the reopens somebody is asking you about are, without exception, in the past. A count read out of that history answers about last quarter this afternoon, with nothing left running for anyone to own.
What to do with a Jira transition count — and what not to
The count for last quarter is available this afternoon. It is read out of history Jira already stored rather than accumulated by a rule somebody remembered to switch on, so the ratio you want to segment and the trend you want to watch both exist before you decide to go looking for them — and there is nothing to set up first, because there is nothing on the page to set. What follows is how to use that without turning it into a target.
Read it as a share, not as a level. Three backward transitions is a number nobody can act on; three backward transitions across five issues is a ratio, and the same ratio next sprint is a trend. The TOTAL row gives you the numerator and the rows give you the denominator, on the same screen, which is why both halves can be quoted in one breath without anyone having to trust a second tool for the second half.
Segment before you compare. A site-wide figure is not actionable; the same figure for one epic, next to the same figure for the next one, is. Run the report on one epic, then on the other, and the difference tells you where a hardening week would pay for itself. That is a filter change and a re-read, not a new report.
Watch the trend across sprints, not the number in one. The question worth asking is whether a process change moved it: add a verification step to the definition of done, run the same filter for the next three sprints, and see whether the backward columns thin out. One sprint's count is weather; three sprints of the same filter is climate.
Do not track it per person. Every backward transition has at least two authors — whoever fixed it and whoever sent it back — and a per-person scoreboard mostly teaches people to route around the transition, at which point the number is dead and the rework is still there. The count is an input to a conversation about verification; the moment it becomes a target, it stops being a measurement.
And pair it with a duration before you draw a conclusion. A count says the issue went round; it never says the round trip was expensive. Two reopens on a one-hour fix and two reopens on a fortnight of rework are the same integer here, and only a duration separates them.
Getting the counts out of Jira
The person who asked the question is usually not the person with the Jira licence, so the counts have to leave the screen.
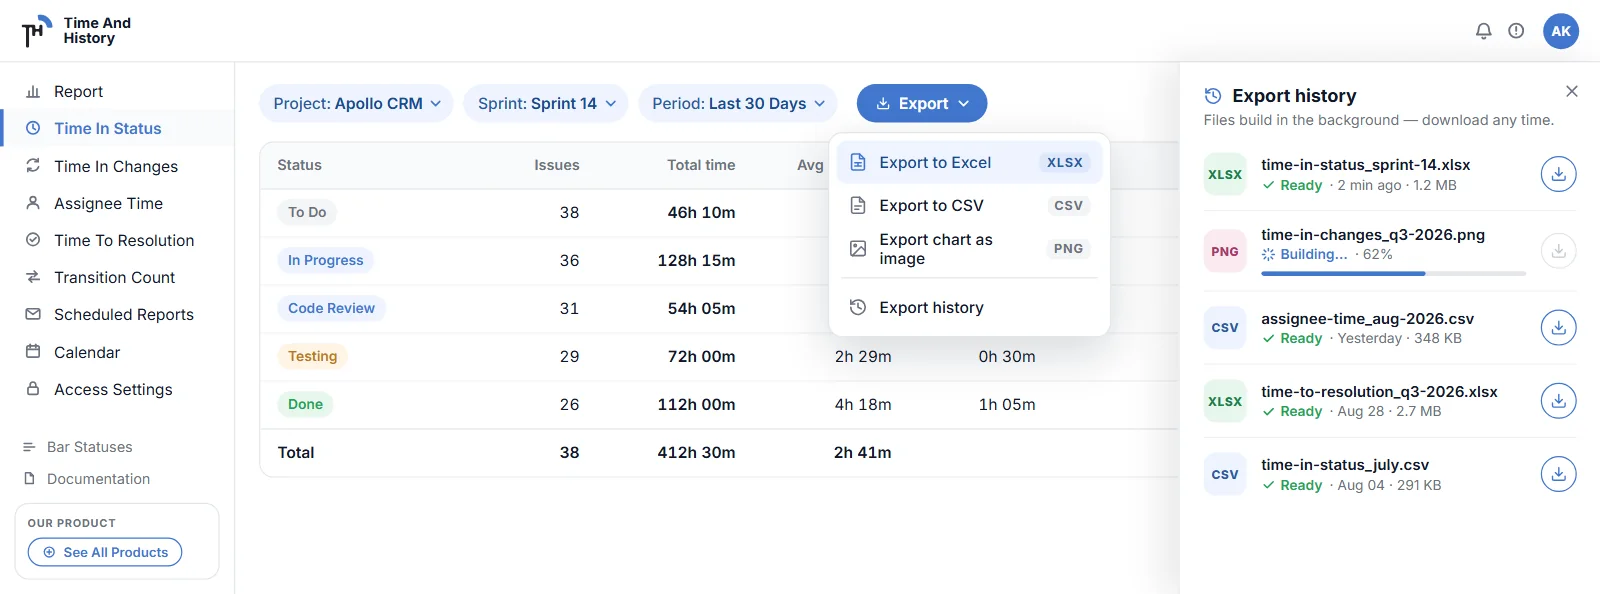
Set your filters, open Export and pick XLSX or CSV. Both run over every issue the filters match rather than the page you were reading. The XLSX is where the scope flips in a way worth knowing: the Issues sheet is one row per issue — issue key, type, summary and assignee as the leading four columns whatever the Columns selector was showing on screen, then a count column per pair, then Total Transitions — and it deliberately carries no totals row, because a total inside a sortable range sorts to the top and doubles every SUM laid over the column. The per-pair totals get a Totals sheet of their own instead, and that sheet covers the whole exported selection, the reverse of the on-screen TOTAL row. The CSV, one flat table by nature, gets the issue rows alone. The export walkthrough covers the mechanics and exporting the full list of formats.
For a team that reads a dashboard rather than a report, the same counts go on a Jira dashboard as a chart gadget and a table gadget — events, not issues, which the stock gadgets cannot chart.
If the number has to arrive without anyone opening the app, a scheduled report can run Transition Count daily, weekly or monthly at a start time and time zone you choose, mailing the XLSX to recipients you type. The filters freeze as you set them, and a run collects as the schedule owner, so recipients see the owner's view of Jira. One difference to know before you put that file in front of a stakeholder: a scheduled workbook carries the same counts and the same Totals sheet, but its pair columns come out ordered by frequency rather than by workflow shape, and headed with the names the changelog recorded rather than the current ones, because a background run has no status catalogue to consult.
Where a transition count is the wrong tool
Three limits, because a report you have to caveat live is worse than one you understood beforehand.
- No creation column. Jira writes no changelog entry for the transition that creates an issue, so the status an issue was born in exists only as the source of its first real change. A "→ To Do" column with an empty source would be an artefact of the reconstruction rather than a move anybody made, so there is not one.
- No drill-down on a row. The rows do not expand. When a count raises a question — who sent it back, on what day, after how long — that is a different report: Time in Changes shows each change with its author, its timestamp, the old and new value and how long the old value was held.
- Counts are not costs. There is no clock in this report at all, by design — which means it can rank what went round most often and never what went round most expensively. For the return trips as measured time, Jira time to resolution gives each resolution its own column with its own duration; for the distribution behind whatever average you compute from these rows, what the mean hides is the reading.
Jira transition count report FAQ
How do I count how many times a Jira issue changed status?
Not natively — Jira stores every change in the issue changelog and aggregates none of it. The manual route is the History tab, one issue at a time, counting by eye. The scripted route is the changelog REST endpoint, one request per issue with pagination to handle. The report route walks the changelog for every issue in your filter and tallies each from → to pair, which is what the Transition Count report is: a column per pair, a count per issue, a Total column and a TOTAL row.
Is there a Jira status transition report in Jira Cloud?
Not a built-in one. JQL's CHANGED operator finds issues that moved along an edge you name, and an Automation rule can increment a custom field from the day you switch it on, but neither produces a per-issue count across a filter, and the Automation counter cannot see anything that happened before it existed. A changelog-based report answers retroactively, because the history is already in Jira.
Does the date range limit which transitions are counted?
No, and this is the caveat most worth carrying. The date range selects the issues, exactly as it does on the sibling reports; it never clips a changelog. Every transition of a selected issue counts, whenever it happened. So "reopens last quarter" is not what the filter gives you — it gives you every reopen, ever, on the issues last quarter selected. For events confined to a window, use chart mode: bar and area bucket each transition by its own timestamp.
Why does a cell show a dash instead of 0?
Because the issue never made that move, which is a fact about the issue rather than a missing value — it is printed in the same weight as a count, not greyed out. The Total column is never a dash: an issue that never moved genuinely has 0 transitions and reads 0. A muted dash in the footer means something different again — that pair's total for the page you are on is unknown, which is not zero.
Can I put a transition count on a Jira dashboard?
Yes. Like every other report in the app, Transition Count has a chart gadget and a table gadget — see the dashboard gadget documentation. For people who never open a dashboard, the routes are a scheduled report, which mails the XLSX on your filters, or a manual export you paste into the page where the discussion happens.
Does renaming a status split the column in two?
No. Pairs are keyed by Jira's status id, not its name, so a renamed status keeps its identity and its column keeps adding up — the header shows the current name, on screen and in an export you run yourself. A status that has since been deleted has no current name at all, and keeps counting under the last name the changelog recorded for it.
What does this cost?
Time And History is free for Jira sites with up to 10 users — Transition Count, chart mode, exports and scheduled reports included, with no separate tier for any of them. Larger sites are on the paid plan, which starts with a free trial from the Marketplace listing; the reports behave identically on both. Checked 7 September 2026 — the listing has the current terms.
Count the round trips on the sprint that just closed
Run Transition Count on one project and last sprint, and find the Done → In Progress column: it sits at the right-hand end of the header, because a move that leaves a Done-category status sorts behind every move that leaves an earlier one. Read In Review → In Progress as well, wherever frequency has put it — that is the work sent back before it was ever accepted — and the TOTAL row under both turns "the same tickets keep coming back" into two integers for the page in front of you. Then find the row with the largest Total and open that issue: it is the retro's whole agenda, and it took a minute to identify instead of an afternoon of History tabs.
Transition Count is one of five reports in Time And History for Jira Cloud — Time in Status, Assignee Time, Time to Resolution and Time in Changes are the others, all counted in business hours against your work calendar, while this one counts events and needs no clock at all. Install it from the Atlassian Marketplace and read the backward columns on the sprint that closed last week — free for up to 10 users, so the first team can try it without a purchase order. The Transition Count documentation has the rest of the rules. Verified 7 September 2026; gadget coverage updated 26 September 2026.