
Someone in sprint review says the work felt slower this month, and nobody in the room can answer with a number. The question underneath is simple — how long does an issue take from In Progress to Done? — and Jira does not store the answer.
The Jira time between two statuses is not a field, not a filter and not a report Jira ships — it is an interval you have to derive, because Jira records the moment a status changed and nothing else. The short answer: read the issue history, find the entry into the first status and an entry into the second, subtract, and decide before you do which entry counts when an issue loops back. That last decision is the whole difficulty. Two tools can report different times for the same issue and both be right — which is why the only number worth taking into a meeting is one that says, in the column header, which rule it used. This covers how to add an In Progress → Done column, what first exit and last exit measure on a reopened issue, and how to read the footer under them.
Why Jira has no field for the time between two statuses
Open any issue and click History: a timestamp, a field, an old value, a new value, and no field named after a status for you to filter on, because Jira never computed one. Deriving an interval from that list is harder than a subtraction, for three reasons.
- A status is not a milestone. An issue can enter In Progress on Tuesday, leave on Wednesday and come back on Friday. "The issue entered In Progress" is not one event with one timestamp; it is a set of them, and picking the wrong member of that set is the most common way these numbers go wrong.
- Reopens are normal, not exceptional. A ticket that reaches Done, fails verification and comes back has two entries into Done. Nothing in the changelog marks one of them as the real one.
- The two statuses need not be adjacent. Work usually reaches Done through review and testing, so the interval you want spans several transitions, not one. A subtraction between consecutive rows answers a different, much smaller question.
The moment an issue visits Done twice, "the time to Done" stops being one number and becomes two. A report that hides that choice from you has quietly made it for you.
How to measure the Jira time between two statuses, step by step
There is no separate status-to-status duration report to go and find. In Time And History, which counts working time per status, the answer is a column on the Time in Status report you already run, and adding one takes about a minute.
- Run the report first. From the Jira top bar, Apps → Time And History, then Time in Status. Set the project, the sprint or epic, the date range and the work calendar, and let the table load. This order is not optional: the From and To lists are built from the issues currently on the report, so an unloaded report has no statuses to offer.
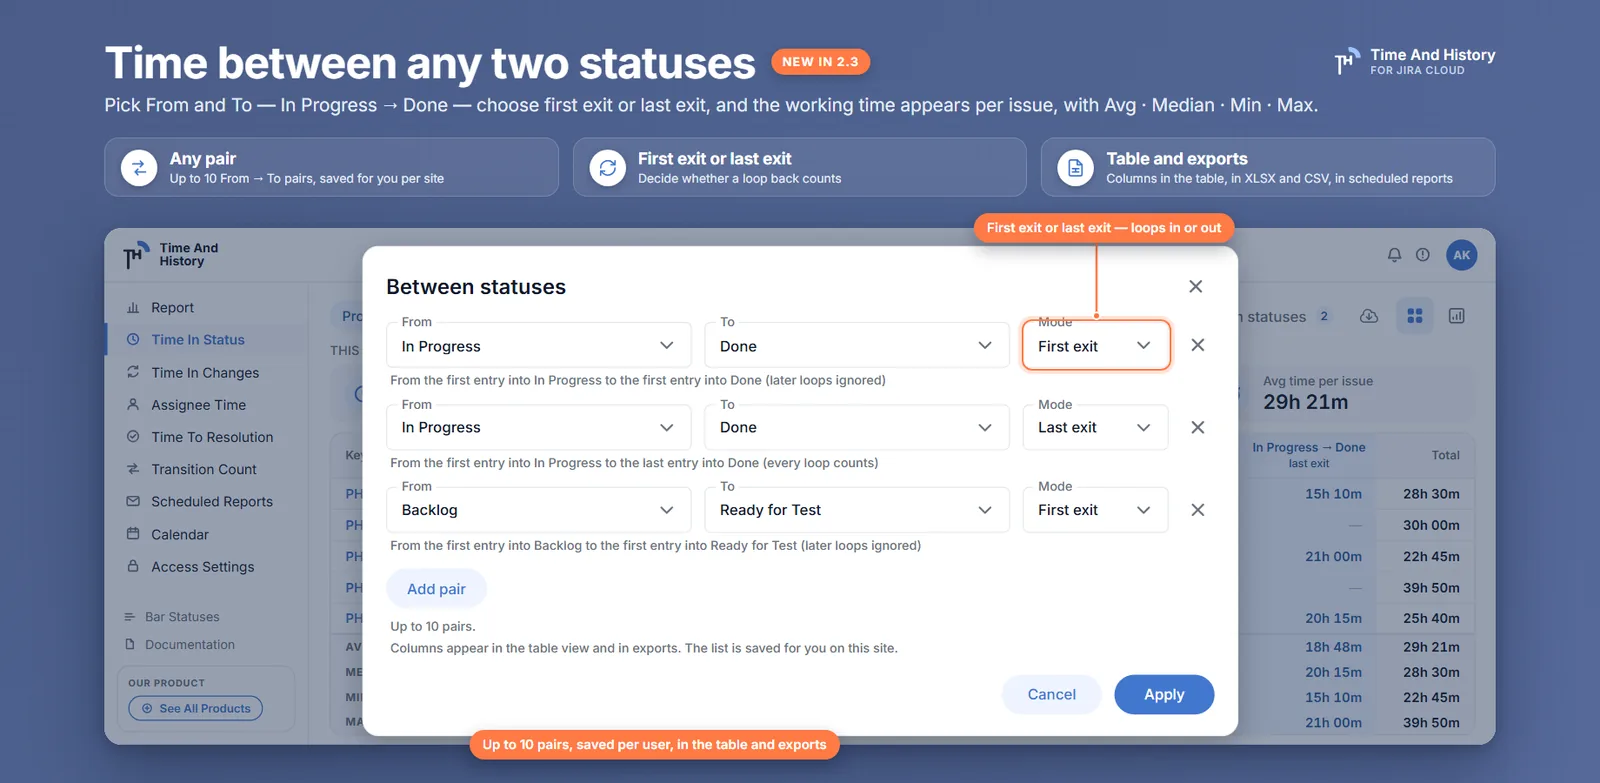
- Open Between statuses. The pill sits to the left of the Export button, and its badge shows how many pairs you already have, so you know whether the columns in front of you are last week's or a fresh start.
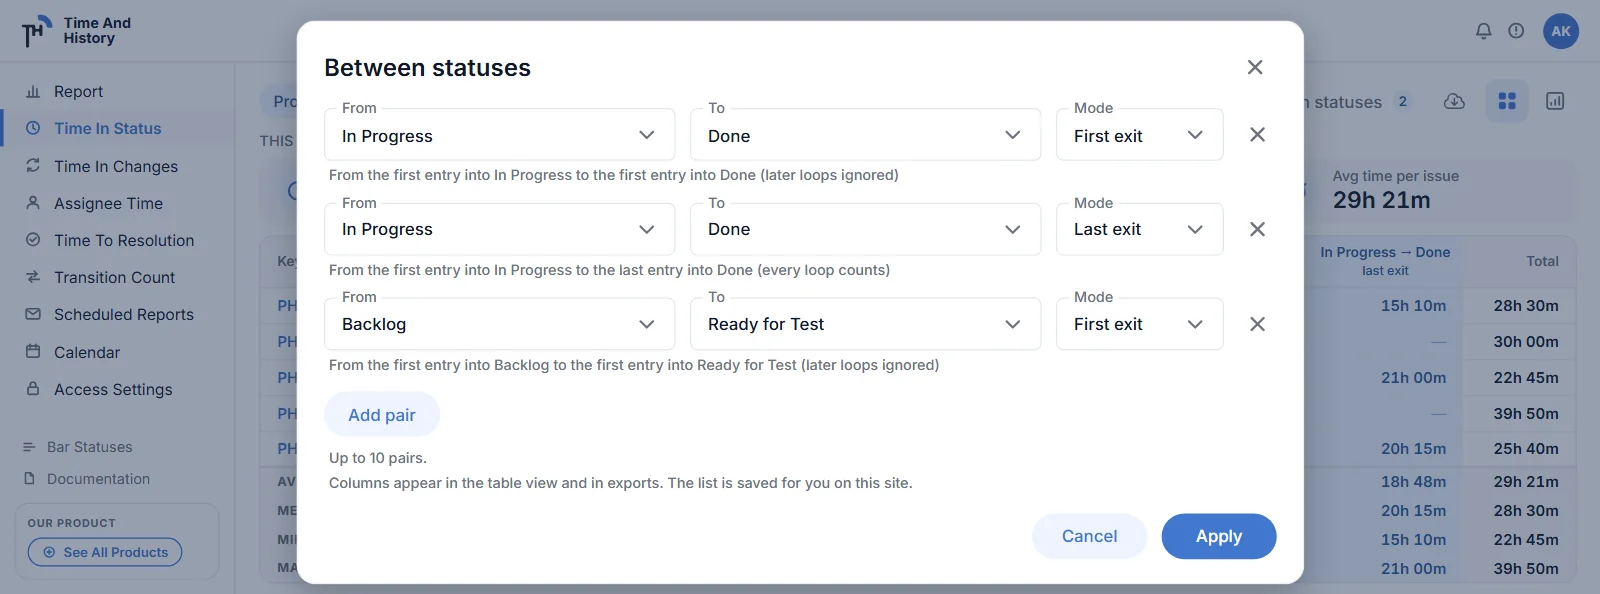
- Pick a From, a To and a mode. One row is one pair: In Progress → Done, on first exit or last exit. The To list never offers whatever From already holds, so a pair cannot point at itself, and the line under each row spells the choice back to you in words before you commit to it.
- Use Add pair for the next one. Up to ten, and the order of the list is the order of the columns — so put the pair you care most about at the top.
- Press Apply. Each pair becomes its own tinted column, headed with the pair — In Progress → Done — and the mode in small type on the line beneath, so nobody reading the table over your shoulder has to guess which one they are looking at.
- Do nothing next time. The list is saved for you on this Jira site: the same columns come back next session and in another browser. There is no rule to keep running, no custom field to protect and nobody to hand it to when you go on leave — the setup is that one minute, and then nothing. It is personal, too: your pairs change nothing for anyone else looking at the same project.
First exit vs last exit: what one reopen costs, in hours
This is the pair of numbers that ends the rework argument: how long the first pass took, and how long the issue really took. Both modes start in the same place — the first entry into the From status — and only the end of the interval moves.
- First exit — the default — runs to the first entry into the To status. Later loops are ignored.
- Last exit runs to the last entry into the To status. Every loop back is inside the number.
For an issue that reached Done once and stayed there, the two modes return the identical number, because there is only one entry into Done to end at. The modes diverge only on rework — which turns the gap between them into a measurement in its own right rather than a discrepancy to reconcile.
Take PROJ-412, on a Monday-to-Friday calendar with working hours from 09:00 to 17:00.
- Tuesday 3 March, 09:00 — To Do → In Progress
- Wednesday 4 March, 15:00 — In Progress → Done
- Friday 6 March, 11:00 — QA fails it after the demo, Done → In Progress
- Monday 9 March, 13:00 — In Progress → Done
First exit measures Tuesday 09:00 to Wednesday 15:00: eight working hours on Tuesday, six on Wednesday, 14h 0m.
Last exit measures Tuesday 09:00 to Monday 13:00: eight hours each on Tuesday, Wednesday, Thursday and Friday, nothing at all over the weekend, four on Monday, 36h 0m.
Both are true, and they answer different questions. The first pass through the workflow took fourteen working hours; the whole journey, rework included, took thirty-six. That 22-hour gap is what the failed hand-off cost, and it is the only version of that cost anyone can check. In a retro it replaces "we had a few reopens" with "the reopen added 22 hours to PROJ-412 and moved the average on this page from 10h 18m to 15h 48m." Add the same two statuses twice, once in each mode, and those two numbers sit side by side as two columns you can read across. The headers below are written in the one-line form an export uses; on screen the mode is the second line of each.
| Key | In Progress → Done (first exit) | In Progress → Done (last exit) |
|---|---|---|
| PROJ-402 | 11h 45m | 11h 45m |
| PROJ-407 | 6h 20m | 6h 20m |
| PROJ-412 | 14h 0m | 36h 0m |
| PROJ-418 | - | - |
| PROJ-421 | 9h 10m | 9h 10m |
| Avg | 10h 18m | 15h 48m |
| Median | 10h 27m | 10h 27m |
| Min | 6h 20m | 6h 20m |
| Max | 14h 0m | 36h 0m |
Three things in that block are worth reading deliberately, because each one is a place where a number gets quoted wrongly.
A dash is not a zero. PROJ-418 shows - in both columns because the interval never happened — it never reached Done at all, or it never entered In Progress to begin with. A zero would claim the journey took no time; the dash says it did not happen. That distinction also keeps the issue out of the summary underneath: the Avg, Median, Min and Max describe the issues that completed the trip, not the ones that started it. When you quote the average, quote the count of issues behind it too, or the open work disappears from the story exactly when it matters most.
One reopen moves the average and leaves the median alone. The footer covers the page you are looking at — it states which page — and it follows the same convention as every other column on the report, which is precisely why you can recompute it from the rows on screen and defend it. Between the two modes the average climbs from 10h 18m to 15h 48m and the maximum from 14h to 36h, and the median does not move at all. That is the distribution telling you the reopen is one issue's story rather than the team's, the reading what the mean hides in a Jira average works through in full.
The clock is your work calendar. PROJ-412's last exit interval is six days and four hours of wall-clock time — 148 hours. Thirty-six is what a Monday-to-Friday, 09:00–17:00 calendar makes of it, and the weekend is most of the difference. Change the calendar and every pair column changes with it, exactly as the status columns do — what a work calendar changes in your numbers has the mechanics. The rule for comparing is the usual one: same filter, same calendar, or the two numbers are unrelated.
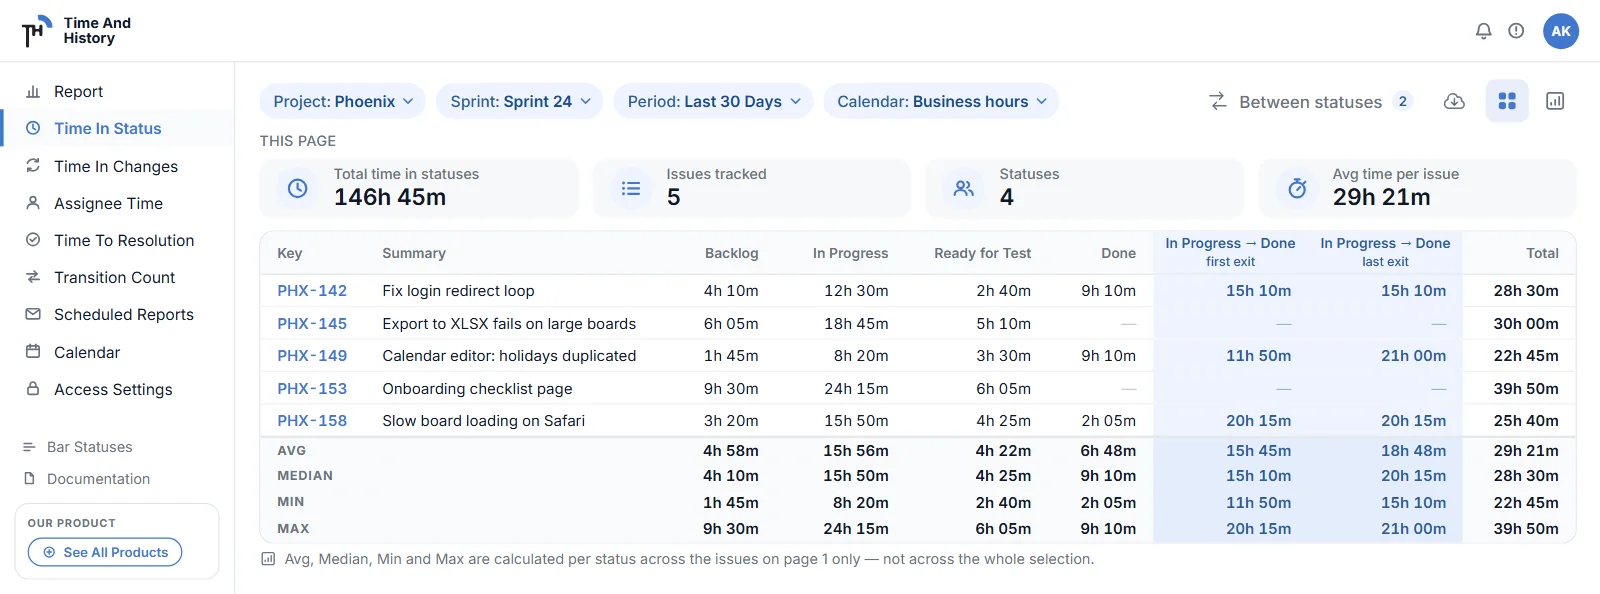
A pair answers one question well and three others badly, so it helps to know where to go instead. Which status ate the interval is the per-status columns next to it, in the same row. How many times the issue looped is Transition Count, which counts status changes rather than hours. And every individual visit, with the working time each one lasted, is Time in Changes. The pair column is the span; those three are what happened inside it.
Four questions to ask any tool that shows you this number
Every status-duration app will hand you an In Progress → Done figure. The figure is not the product; the ability to defend it is. Before you standardise on one, open it and check:
- Does the number say which loop rule made it? Here the mode is the second line of the column header on screen and part of the header cell in the export, so the rule travels with the number instead of living in someone's memory.
- Can you see the first pass and the whole journey at once? Add the same pair twice, one mode each, and the gap between the columns is the rework, per issue.
- Does an unfinished issue show a dash or a zero? A zero quietly drags the average down and hides the open work; a dash keeps that issue out of the Avg, Median, Min and Max.
- Can you recompute the summary from the rows in front of you? The footer covers the page it names, in the same convention as every other column — which is what makes it survive being questioned.
If your board has an issue like PROJ-412 — and it does — the two columns above take about a minute to add to last sprint's report. Time And History is free for up to 10 users.
What Jira gives you without the app
One question arrives as soon as the column is on screen: could Jira have done this? Four native routes get partway, and the closest one makes the decision above for you without saying so.
Jira Automation is the only stock feature that will compute and store a duration: stamp a date custom field when the issue enters the first status, subtract it when the issue enters the second. Then a reopened issue arrives. A rule that fires on entry to Done overwrites the first pass with the second every time the issue loops back, so what you end up storing is last exit, whether or not that is the number you wanted. Two more limits sit on top of that: the rule cannot see the past, only transitions after you switch it on, and Automation's date smart values have no business-hours unit — businessDays counts whole Monday-to-Friday days, blind to working hours and holidays.
The other three stop earlier. JQL's history operators say which issues moved, never how long; the Control Chart plots elapsed time per issue but is board-scoped, maps by column rather than by status, and has no working-hours clock; the changelog endpoint has everything, at the price of pagination, a request per issue and a business-hours implementation you maintain. The full survey, with what each one answers well, is the table in the Time in Status report walkthrough.
The difference that decides it is usually not accuracy but calendar time. A rule starts counting the day you turn it on, so the answer for last quarter arrives next quarter — and somebody owns the rule, the custom field, and the edit every time the workflow changes. A pair column is read out of the history Jira already stored: add it this afternoon and last sprint is on screen, with nothing left running for anyone to maintain.
Getting the pair columns out of Jira
The columns are not a screen-only feature, which matters because the person who asked the question is usually not the person with the Jira licence.
Set your filters, open the Export menu and pick MS Excel Report (.XLSX) or Plain Text Report (.CSV). Every pair column travels into both, and the export runs over every issue matching the filter rather than the page you were reading — so the file is the wide view even when the footer was not. In an export the pair and its mode are joined into one header cell: In Progress → Done (first exit). The CSV carries a byte-order mark, so Excel renders the arrow instead of mangling it. Files land in Export history, which keeps your twenty most recent, private to you; the export walkthrough covers the mechanics and exporting the full list of formats.
If the number has to arrive without anyone opening the app, a scheduled report on Time in Status carries the pair columns too: daily, weekly or monthly, at the start time and time zone you choose, as an XLSX to up to ten recipients you type. The filters freeze as you set them, and every run is listed in Export History. A run collects as the schedule owner, so recipients see the owner's view of Jira.
Where a status pair is the wrong tool — and what to use instead
Four limits, because a report you have to caveat in the meeting is worse than one you understood beforehand.
- No metric of ours to argue with. Time And History publishes no named measurement between two points and no benchmark to fail against. What it publishes is the working time from the first entry into a status you chose to an entry into a status you chose, per issue, on your calendar, with the loop rule in the column header. If your team has a name for that number, the name is yours — and so is the definition, which is the only version anyone defends in a retro. When the interval you actually promise runs from creation to resolution instead, Jira time to resolution measures that one on the same clock, with Done 1st, 2nd and 3rd columns for reopened issues.
- Ten pairs, and no more. Enough for the two or three transitions a team argues about, plus both modes on each. If you find yourself wanting a dozen, the question has probably turned into a per-status question, which the Time in Status columns already answer without any setup.
- No gadget for the pairs. All five reports ship as gadgets, but Between Statuses is a Time in Status feature, not a report — put a Time in Status gadget on a dashboard and you get per-status working time, not pair columns. The gadget list says what is on the board and what is not.
- No chart for these columns. Chart mode and the KPI tiles draw the per-status data; the pair columns live in the table and leave it through an export. Read them as rows, sorted, next to the issue keys — which is the format the follow-up conversation needs anyway, and the one an export drops straight into the deck.
Jira time between two statuses FAQ
How long does it take from In Progress to Done in Jira?
No native Jira report answers it — you derive it from the issue history: find the entry into In Progress, find an entry into Done, subtract, and decide which entry counts when the issue went round twice. In Time And History it is a column: open Between statuses on the Time in Status report, add the pair, and every issue gets the working time between the two against your work calendar.
Should I use first exit or last exit?
Ask what the number is for. First exit — the first entry into From to the first entry into To — answers how long does one pass through the workflow take, and a reopen never inflates it. Last exit runs on to the last entry into To, so it answers when was this actually finished, which is usually what a stakeholder means. If the argument is about rework, add both and read the gap. For an issue that made the trip once the two are identical, so a second column costs nothing.
Why does a Between Statuses column show a dash instead of 0?
Because the interval never happened: either the issue never entered the From status, or it never reached the To status after it. A zero would say the journey took no time; the dash says it did not happen, which is a different fact and usually a more interesting one. Issues showing a dash are also excluded from that column's Avg, Median, Min and Max, so the summary describes the issues that completed the interval.
How do I defend this number when someone challenges it?
Three habits make it hold. Quote the count of issues behind the average — a dash keeps unfinished work out of the summary, and the open work is exactly what a challenger will look for. Say which mode the column used; it is printed under the header and carried into the export, so it is not a matter of memory. And compare only like with like: same filter, same work calendar, or the two numbers are about different things. The footer covers the page it names, in the same convention as every other column on the report, so anyone who doubts it can recompute it from the rows on screen.
Does the time between two statuses exclude weekends?
Yes, if your work calendar says so. Pair columns are working time, measured against the same calendar — business days, work hours, time zone and holidays — as every other duration in the app. In the worked example above, 148 hours of wall-clock time between a Tuesday morning and the following Monday afternoon becomes 36 working hours on a Monday-to-Friday, 09:00–17:00 calendar.
Can I put the time between two statuses on a Jira dashboard?
Not as a gadget — the dashboard gadgets cover the five reports themselves, and Between Statuses is a Time in Status feature rather than a report. The route to people who do not open the app is a scheduled Time in Status report, which mails the XLSX with the pair columns included, or a manual export you paste into the page where the discussion actually happens.
Do my pairs affect what my teammates see?
No. The list is saved for you on that Jira site, so your columns come back next session and in another browser, and nobody else's report changes. Two people can read the same project with different pairs and different modes, and both tables are correct.
Can I see the first pass and the total in the same table?
Yes, and it is the most useful configuration there is: add the same two statuses twice, once on first exit and once on last exit. You get two columns side by side, and the difference between them on any row is what the rework cost. Where the two columns are equal, the issue went through once.
What does this cost?
Time And History is free for Jira sites with up to 10 users — pair columns, exports and scheduled reports included, with no separate tier for them. Larger sites are on the paid plan, which starts with a free trial from the Marketplace listing; the reports behave identically on both. Checked 6 September 2026 — the listing has the current terms.
Add the pair you actually argue about
Pick the two statuses your team disagrees about — usually In Progress and Done, sometimes Ready for Test and Done — and add them twice, once in each mode, on the sprint that closed last week. Read across one row: where the two columns match, the issue went through cleanly; where they diverge, the gap is what the reopen cost, in hours, against your calendar. That is a five-minute exercise that ends the "it felt slower this sprint" conversation with a sortable column instead of an impression.
Time in Status is one of five reports in Time And History for Jira Cloud — Assignee Time, Time to Resolution and Time in Changes are the others, all counted in business hours against your work calendar, plus Transition Count, which counts status changes rather than hours. Install it from the Atlassian Marketplace and add one pair to last sprint's report — free for up to 10 users, so the first team can try it without a purchase order. The Between Statuses documentation has the rest of the rules. Verified 6 September 2026.