
The monthly review has two numbers on it and they disagree. The SLA dashboard says the team met its promise; the resolution-time chart says the same month got slower. Nobody in the room can say which one is wrong, because nobody can say what either number counted.
Jira time to resolution is the easiest metric to define and the hardest to defend: created to resolved, in business hours. The short answer is that the interval hides which of the waiting was anybody's to fix; that a reopened issue has two resolution times and most reports keep one; and that the clock you measure on moves the figure further than any other control on the page. This covers what the interval contains, what Done 1st, Done 2nd and Done 3rd cost you in hours, and how far the number carries as an SLA measure when you do not have Jira Service Management.
What Jira time to resolution measures — and what it hides
The number bundles together periods the team controls and periods it does not. An issue waiting on a customer, an issue blocked on a third-party release and an issue sitting in a review queue all inflate the same figure — but only one is a problem the team can fix this week.
It also depends on which clock you use, and the two clocks disagree by more than people expect. A bug raised on a Friday at 16:40 and resolved the following Tuesday at 11:20 is just under four calendar days old; on a 09:00–17:00 working week with the weekend off, the same bug consumed ten hours and forty minutes of business time. Both are correct. The first is what the customer experienced; the second is how much of the team's working day the issue occupied.
Jira itself does not keep that figure. It keeps the created date, the resolution date and the history in between; turning those into a per-issue duration in business hours is what the Time to Resolution report in Time And History for Jira Cloud does.
What Jira gives you without an app
Jira keeps the timestamps, never the durations: on resolution time it offers an averaged chart in company-managed projects and, by Atlassian's own account, no per-issue figure at all in Software and Business projects.
| Native option | What it answers | Where it stops |
|---|---|---|
| Resolution Time report and gadget (Project → Reports) | Average created-to-resolved, charted per period, for company-managed projects | Aggregated bars over a period, not a sortable per-issue table; calendar time, with no working-hours concept; no way to ask about any segment inside the created→resolved interval |
| Control Chart (Board → Reports) | Cycle-time and lead-time trend for work that passed through the columns you select — the closest native thing to a real duration measurement | Elapsed time only: Atlassian's page contains no concept of weekends, holidays or working hours anywhere in the chart. Board-scoped, with no per-issue duration table behind it to export |
| JQL history operators (WAS, WAS IN, CHANGED) | Which issues were ever in a status, or changed by whom, when, from what and to what — with AFTER, BEFORE, BY, DURING and ON | Every query returns a set of issues, never a number. No duration function, no aggregate, and only six fields carry history (Assignee, Fix Version, Priority, Reporter, Resolution, Status) |
| Jira Service Management SLAs (Time to resolution) | A real calendar-aware clock with start, pause and stop conditions with working-hours calendars — the capability genuinely exists in Atlassian's stack | Service projects only, which is not where most of these questions get asked. Each SLA measures the one interval its start, pause and stop conditions define, against the calendar attached to it — not the arbitrary segments of an issue's life you might want to compare |
| Jira Automation stamping a date custom field | A duration you compute and store yourself, on any pair of events you can write a rule for | It cannot see the past, only transitions after you switch it on, and businessDays counts whole Monday-to-Friday days with no working hours or holidays in it. Somebody owns the rule, the field, and an edit every time the workflow changes |
| Issue export to CSV, subtracted in a spreadsheet | Created and Resolved per issue — the route most teams try first, and it is free | NETWORKDAYS counts whole days, so a 16:40 Friday and a 09:00 Monday come out the same; per-weekday hours, a time zone and a holiday list are not a formula; and resolutiondate holds only the last resolution, so every reopen in the file has already been overwritten before you open it |
| Time And History — Time to Resolution | The working time to resolution per issue against your work calendar, with every resolution in its own column so reopens stay visible, filtered by project, epic, sprint, reporter or assignee, and exportable | One interval, created to resolved: no per-status clock, no pause and resume, no breach alert. The tiles above the table give the average for the page you are on; the median and the percentiles are a formula on the export — and the export covers every issue the filter matches, not the page |
How many times was a Jira issue reopened? Done 1st, Done 2nd and Done 3rd
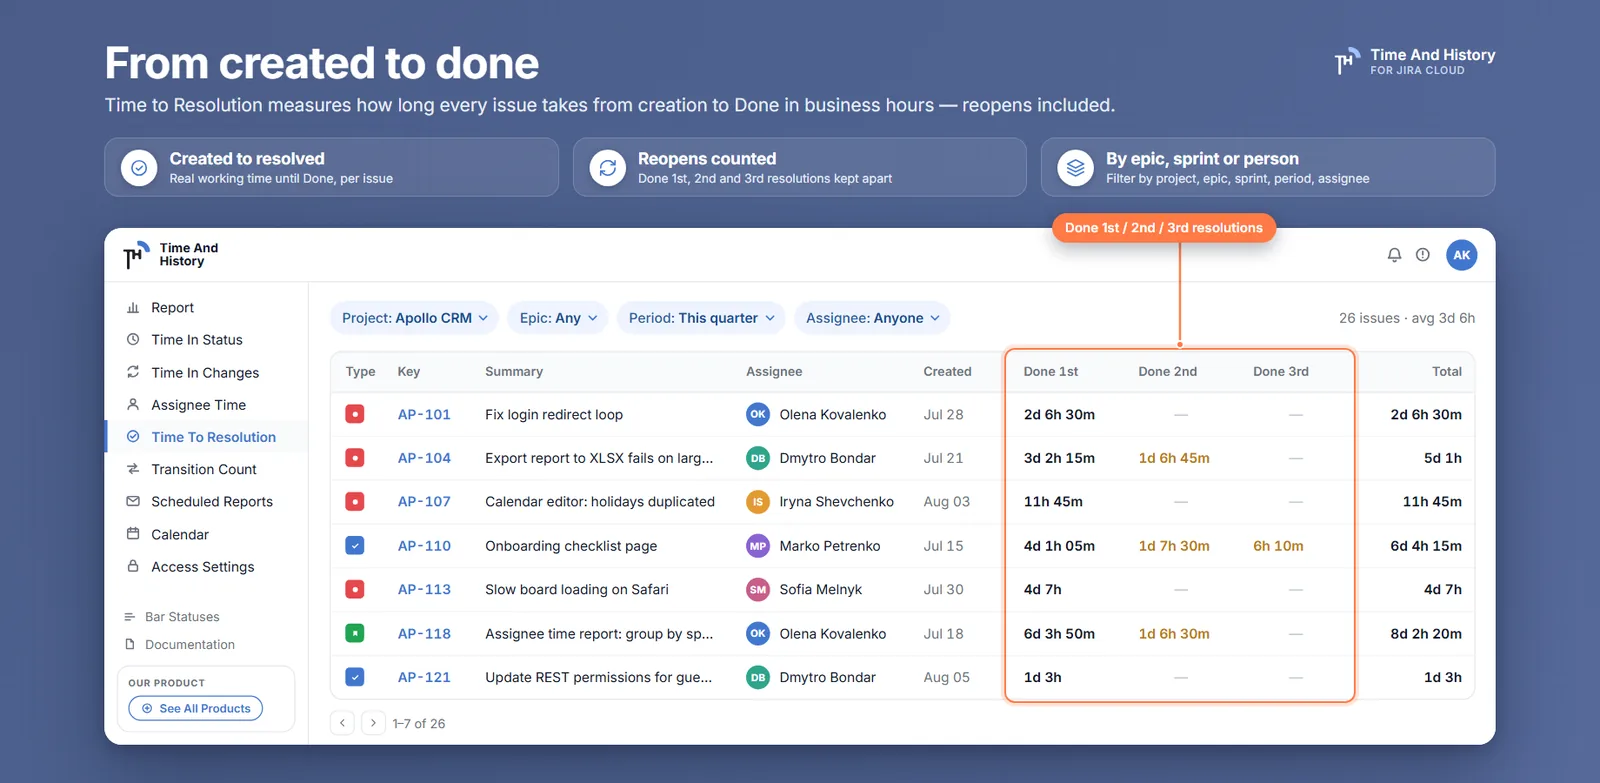
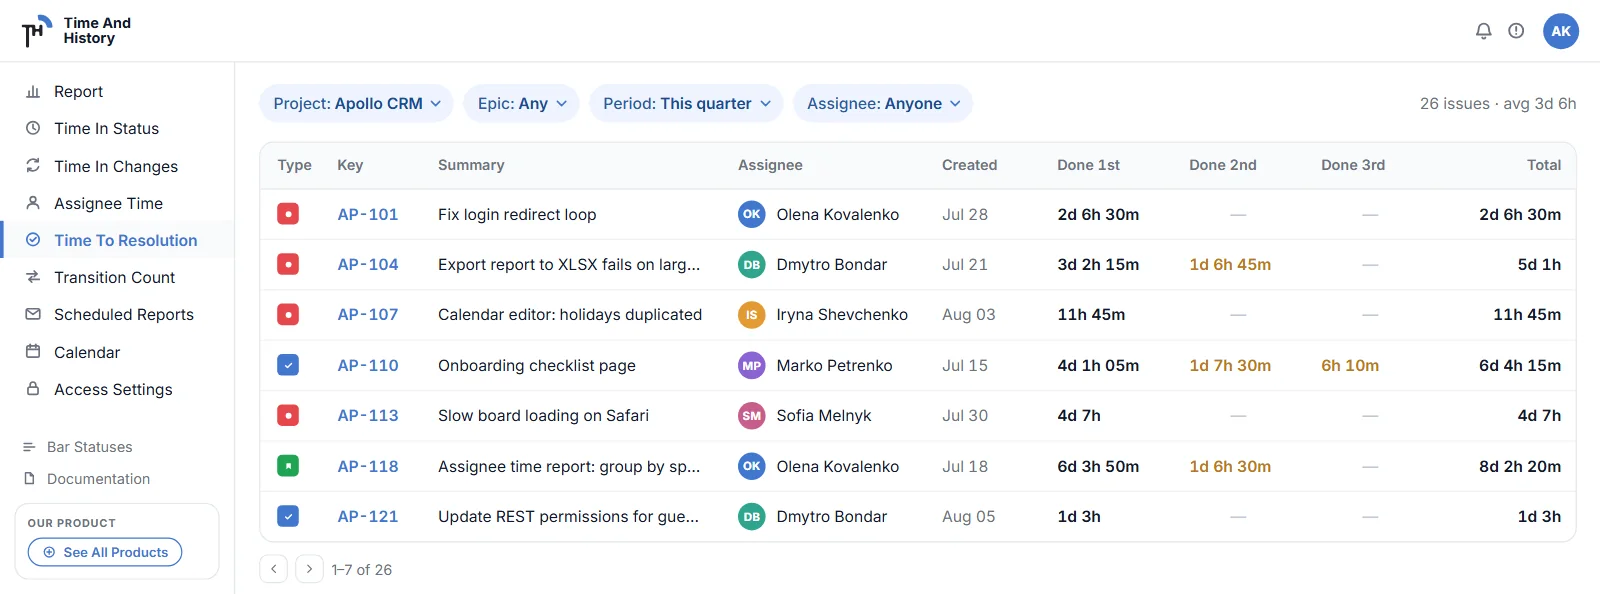
An issue that was resolved, reopened and resolved again has two resolution times, and most reporting keeps one of them. Time to Resolution keeps both, in columns named after the resolution value itself: one column per resolution, with an ordinal added when the same one repeats. On a default Jira workflow that reads Done 1st, Done 2nd, Done 3rd; a team that resolves as Fixed sees Fixed 1st, and an issue resolved Done and then Won't Do gets one column each. There is no fixed set of three — a fourth round produces a fourth column. The report counts resolutions, not transitions, whatever the workflow calls the status an issue returned to.
Read the columns as passes rather than as repeated end-to-end clocks. Done 1st runs from creation to the first resolution. Each later column runs from the reopen to the resolution that closed it — the cost of the rework itself, which is a better number for a retro than a re-run of the whole clock. Total Time To Resolution is those passes added together, so the stretch an issue spends sitting resolved is not inside it. For an issue resolved once, the first column and the total are the same figure.
Done 1st alone is the healthy shape, work going out once. A Done 2nd column that keeps filling over successive sprints is one of two things, and they need different fixes. Either it is hand-back — developers resolve, QA finds the same defect class, the issue returns — and the fix lies before the first resolution. Or the definition of done was never agreed, and issues bounce on whether a change counts as finished without a migration note, a toggle or a test: cheaper to fix, more embarrassing to discover. Anything in Done 3rd is worth reading issue by issue rather than statistically.
Take PROJ-318, on a Monday-to-Friday calendar with working hours from 09:00 to 17:00. Created Monday 2 March at 10:00 and resolved Wednesday 4 March at 12:00 — seven working hours on Monday, eight on Tuesday, three on Wednesday: 18h 0m in Done 1st. On Friday 6 March at 15:00 it comes back, because the change shipped without its migration note, and it is resolved again on Tuesday 10 March at 12:00 — two hours on Friday, nothing over the weekend, eight on Monday, three on Tuesday: 13h 0m in Done 2nd. Total Time To Resolution carries 31h 0m: the two passes added together, without the nineteen working hours the issue spent sitting resolved in between. Eight calendar days, 194 wall-clock hours, thirty-one working ones.
| Key | Created | Done 1st | Done 2nd | Done 3rd | Total |
|---|---|---|---|---|---|
| PROJ-311 | 2 Mar | 12h 30m | - | - | 12h 30m |
| PROJ-318 | 2 Mar | 18h 0m | 13h 0m | - | 31h 0m |
| PROJ-322 | 3 Mar | 6h 45m | - | - | 6h 45m |
| PROJ-327 | 4 Mar | - | - | - | - |
Read across the row rather than down to the total. A report that keeps one resolution time per issue has picked a rule for you, and PROJ-318 becomes a single figure: eighteen hours if it keeps the first pass, thirty-one if it adds the passes, fifty if it runs an unpaused clock from creation to the last resolution. None of the three says the thing that decides what to do next — the promise was met on the second attempt, and that attempt cost 13h 0m on its own. PROJ-327 is a dash in every column because it is not resolved yet, so an unfinished issue never quietly drags the figures down.
This is the part a spreadsheet cannot reach. Jira's issue export carries one resolution date per issue — the last one — so a file built from created and resolutiondate reports PROJ-318 as an issue resolved on 10 March and never shows that it went out twice. Recovering the first resolution means reading the changelog of every issue, one request at a time, and pairing the entries yourself. The percentile at the end is a spreadsheet job either way; the rows underneath it are not.
Count the second columns before drawing conclusions from the first: a team whose median resolution time improved while its reopen rate doubled has not got faster. If the hand-back is between people rather than stages, Assignee Time shows who was holding the issue while the clock ran.
If an issue on your board went out twice last quarter — and one did — that second resolution is already in the history; the report only has to be pointed at it. Time And History is free for up to 10 users, so the first team can check last month's promises without a purchase order.
How to build a Jira time to resolution report: six steps
- Open Time And History from the Jira top navigation and choose the Time to Resolution report. It is one of five reports in the app; the others are Time in Status, Assignee Time, Time in Changes and Transition Count.
- Set the Project, then narrow with Epic, Sprint, Reporter or Assignee. An empty dropdown means any, so a project on its own is a valid start — but a whole project across a year is rarely the population anyone manages.
- Choose the work calendar. This is the setting that decides whether a weekend counts. A work calendar carries business days, per-weekday hours, a time zone and holidays with a repeat every year option. Calendars are not assigned to projects: the list belongs to the site, the choice belongs to you. Pick one and Time And History remembers it across sessions, applying it to every report and every dashboard gadget you view. It changes nothing for anyone else: two people can read the same project against two calendars and both be right. The clock decides more of the figure than any other control on the page — the Friday bug above is just over ninety hours of wall-clock time and ten hours forty of working time — so read what a work calendar changes in your numbers before anyone argues about a figure.
- Set the date range, and the field it is applied to. The range can be applied by Created, Updated or Resolved, with presets or a custom range. For an SLA check the field is Resolved; for a cohort question — "how long did the work we took on in Q2 take" — it is Created. Picking the wrong one is the commonest way to get a defensible-looking number that answers a question nobody asked.
- Read the columns. The row opens with type, key, priority, reporter, assignee and status; add Created from the column picker if you want the date on the row. Then come the resolution columns — Done 1st, Done 2nd, Done 3rd on a default workflow — and a Total Time To Resolution column. Issues that are not resolved yet show
-rather than a running total, so an unfinished issue never quietly drags the figure down. The KPI tiles above the table — Total time to resolution, Issues tracked, Resolutions and Avg time per issue — carry the caption This page, and the page is fifteen rows by default. That scope is what makes them checkable: recompute them from the rows in front of you and they reproduce. Avg time per issue divides by the issues that actually reached a resolution, so the dashes stay out of it. Switch to chart mode — donut, bar or area — and the same four tiles recompute over the Whole selection, every issue the filter matches, with the caption changing to say so. - Export the whole population. The export runs over every issue matching the filters, not the page on screen, and builds an
XLSXor aCSVin the background — plus aPNGof the chart when you export from chart mode. That matters more here than on any other report: the number you actually want — the median, the 90th percentile — is computed in the spreadsheet. The file carries the issue key, type, summary and assignee, one column per resolution and the total, which is enough for both. How the exports work.
Nothing above keeps running. The report is read out of the history Jira already stored, so the answer for last quarter is on screen this afternoon rather than a quarter after somebody switches something on — which is usually what decides it against the Automation route, where a rule stamps a date field from the day it is enabled, sees nothing before that, and leaves somebody owning the rule, the field and an edit every time the workflow changes. There is no custom field to protect here and nobody to hand it to when you go on leave. The work calendar is the single setting, it is remembered for you across sessions, and it is yours alone.
Jira SLA tracking without Jira Service Management: what you get and what you don't
Be precise about the offer. Time And History does not define SLA rules: no targets, no breach states, no notifications. The six steps above produce the number an SLA is measured against, per issue, on the clock your SLA text describes. The gadgets run the same calculation without the per-issue rows — the chart gadget draws a donut, bar or area chart, and the Time to Resolution (Table) twin shows KPI tiles above an aggregate table with a Total row.
What you do not get:
- No per-status SLA clock. The report measures the passes to resolution, not the statuses inside them.
- No pause and resume. Nothing stops the clock while an issue waits on a customer.
- No breach notifications. Nothing watches a threshold. Since version 2.3.0 the report can arrive by email on a clock — a scheduled report mails the XLSX daily, weekly or monthly to up to ten recipients you type — but that is a schedule, not an alert: it goes out whether or not anything breached.
- No median or percentile in the report. The tiles give you the average, captioned with the scope it covers; a median and a 90th percentile are formulas on the export. What the report gives you instead is the row every percentile would be computed from, which is the half that is hard to get and the half an averaged chart destroys.
PERCENTILEover a column of the export is one formula, and it is yours to defend.
Jira Service Management does have that clock — start, pause and stop conditions on a working-hours calendar — in a product a bug tracker or an internal board rarely justifies licensing.
Time to Resolution cannot pause the clock per status; what it does leave out is the stretch an issue spends already resolved. Reconciling it with a paused SLA is not arithmetic worth repeating every month. The useful output is an agreed list of pausing statuses, written into both the SLA definition and the report you check it against, so the two documents stop describing different intervals.
When the promise is narrower than the whole run to resolution — from the moment work starts to the moment it ships — measure that span directly instead: the time between two statuses puts In Progress → Done in a column of its own on Time in Status, on the same work calendar, and lets you decide whether a reopen counts. A status pair narrows the interval to two points you name, which is a different fix from stopping the clock inside it.
Three questions to ask any resolution-time report
Every app in this category will hand you a created-to-resolved figure in business hours. The figure is parity; what the report did with the awkward issues is not.
- What does it do with a reopened issue? One total, the first resolution, or the last? Whichever it picked, it picked for you. Here each resolution keeps its own column, and the Total sits beside them rather than instead of them.
- What does an unresolved issue count as? A running total drifts upward every day with no transitions happening at all. Here it is a dash, so an unfinished issue never quietly drags the figure down.
- Which hours did it count? A number with no named calendar cannot be compared with anything, including last quarter's version of itself. Here the calendar is a control you pick before you read the number, and the same one drives every report in the app.
Ask the same three of the report you have now. If the answers are not printed anywhere, the number is not yet an argument.
Where the time went: pairing Time to Resolution with Time in Status
Time to Resolution answers how long did this take, end to end.
Time in Status answers where did that time go. It is the report that splits the total into the intervals it is actually made of — see how a Jira time in status report is built from the issue history for the mechanics:
- Time before triage. Created until someone accepted it. Usually a queue problem, not a delivery problem.
- Time in active work. The part most people assume the whole number describes.
- Time waiting on someone else. Customer, vendor, another team.
- Time after work finished. Waiting for release, verification or a deploy window.
Read side by side, they turn one contested figure into four with different owners.
Why an average resolution time misleads
One issue that sat open for eight months will drag an average past the point of usefulness. The app gives you that average — the Avg time per issue tile, over the page you are reading or, in chart mode, over the whole selection — and the per-issue rows every other statistic is computed from. The median and the tail are still a spreadsheet step: export the report to XLSX or CSV and take them there — the median for the typical case, the 90th percentile for the tail your customers actually complain about, and both over the population you meant, since "resolved last month" and "created last month" are different sets of issues. The average is the one number that describes neither case; what the mean hides in a Jira average works the gap through in full.
Jira time to resolution FAQ
How do I see time to resolution in Jira?
Natively, the closest thing is the Resolution Time report in a company-managed project's Reports section, which charts an average per period in calendar time. For a per-issue figure in business hours, open the Time to Resolution report in Time And History, pick a project and a work calendar, and read the Total Time To Resolution column — with the resolution columns beside it, so a reopened issue does not hide inside one total.
How do I count reopens from the Done columns?
Count the filled resolution columns and subtract one, with one caveat: a column appears when a resolution is set, and a reopen clears it, so the count covers the reopens that were resolved again. An issue reopened and still open shows Done 1st alone. For the return trips themselves, open ones included, Transition Count counts how many times each status pair occurred per issue.
Can I track SLAs in Jira without Jira Service Management?
You can track the number an SLA is measured against, but not the SLA itself. Jira Software and Jira Business projects have no SLA engine — start, pause and stop conditions and working-hours calendars exist in service projects only. Time to Resolution gives you the working time to resolution per issue, with reopens in their own columns and a date range by Resolved, so last month's issues can be checked against the target you promised. What it will not do is pause the clock while an issue waits on the requester, or notify anyone about a breach.
Does Jira have a resolution time report?
Yes and no, and both halves matter. A Resolution Time report is listed among the general reports for company-managed projects, and it is an averaged chart over a period. Atlassian's Cloud knowledge base separately states that there is no report giving the resolution time of individual issues in Software and Business projects. The two are not in conflict — one is an aggregate, the other is the per-issue value people mean when they ask.
Does Jira time to resolution exclude weekends and holidays?
Not in any native report. The Resolution Time report and the Control Chart both measure elapsed time, so a bug raised on Friday afternoon carries the whole weekend into its figure; the only native clocks aware of a working week are Jira Service Management's SLA calendars, which exist in service projects only, and Automation's whole-day businessDays unit. Time to Resolution measures against the work calendar you selected — business days, per-weekday hours, a time zone and yearly holidays — so a Monday-morning resolution does not inherit Saturday and Sunday.
Can I put time to resolution on a Jira dashboard?
Yes. Two of the dashboard gadgets cover this report: a chart gadget that draws a donut, bar or area chart, and a Time to Resolution (Table) gadget with KPI tiles above an aggregate table and a Total row. Neither gives you the per-issue rows — for those, open the report itself or take the export.
Can Jira email a resolution time report on a schedule?
Not on its own, but the app will. Set the filters on the report page, then create a scheduled report: daily, weekly or monthly, at the start time and time zone you choose, with the filters frozen as you set them. The XLSX arrives as an attachment to up to ten recipients you type yourself, and every run is listed in Export History. A run collects as the schedule owner, so recipients see the owner's view of Jira.
How do I defend a resolution-time number when someone challenges it?
Say what it covers before you say what it is. The tiles describe the page you are reading, unless you are in chart mode, where they cover every issue the filter matches — so quote the export for a population and the screen for a check, and anyone who doubts the screen can recompute it from the rows on it. Say which date field the range was applied to: resolved last month and created last month are different sets of issues and will never agree. Say which work calendar produced it, because the same bug is ten hours or four days depending on that one control. And read Done 1st against Done 2nd out loud: a figure that improved while the second column filled is not a team that got faster.
What does this cost?
Time And History is free for Jira sites with up to 10 users — every report, the exports and the scheduled reports included, with no separate tier for them. Larger sites are on the paid plan, which starts with a free trial from the Marketplace listing; the reports behave identically on both. Checked 6 September 2026 — the listing has the current terms.
Put a number behind the promise
If your resolution-time figure is a chart nobody can act on, replace it with a per-issue table on a clock you agreed: pick the work calendar, set the date range by Resolved, read Done 1st against Done 2nd, and take the median to a spreadsheet.
Time And History for Jira Cloud produces it. Five reports read out of Jira's issue history — Time in Status, Assignee Time, Time to Resolution and Time in Changes — all in business hours against your work calendar, plus Transition Count, which counts status pairs per issue rather than hours: the reopen question above, asked of the whole workflow. Since version 2.2.0 there is also a pair of Time to Resolution dashboard gadgets — a chart, and a (Table) twin with KPI tiles and an aggregate table rather than the per-issue rows — which is the fastest way to keep the headline number on a Jira dashboard. Install it from the Atlassian Marketplace and read Done 1st against Done 2nd on last quarter's closed bugs — free for up to 10 users, so the first team can put a number behind the promise without a purchase order. The Time to Resolution documentation has the rest of the rules. Verified 6 September 2026.