
Someone says the team is overloaded, and the only evidence in the room is a board grouped by assignee. It shows who is holding each issue this morning — which is not the same claim, and not the one being argued about.
The bug on that board sat three days with the triager who filed it, more than two with nobody assigned, and three and a half hours with the developer whose name is on it now. Every native workload view in Jira counts that as one issue on the developer's plate. Jira recorded all three hand-offs, with timestamps, and turned none of them into a duration.
The short answer: assignee changes sit in the issue history with timestamps and no durations, so you pair each change with the next and book the interval to whoever held it, on your work calendar. That is what the Assignee Time report in Time And History for Jira Cloud does. This covers how that arithmetic works, how to read a matrix whose rows are issues and columns are people, what the Assignee Time (Table) gadget pivots, and where the number stops being a workload signal and starts being read as a scoreboard.
Why the current assignee in Jira is a bad historian
Jira's own workload views — the User Workload report, the Workload Pie Chart gadget, a board grouped by assignee — all answer the same question: who holds each issue right now. It is the most available number and the least informative one, because it says where the work sits this morning and nothing about the week that got it there.
The interval each person actually held the issue is the thing worth measuring. Jira stores the moments at which a field changed, never the intervals between them.
Time per assignee in Jira: reading it from the issue history
Assignee changes are in the issue history, exactly like status changes. Pair each change with the next, attribute the interval to the person who held it, and you get time per person rather than issues per person. That is what Assignee Time reports: one column per assignee, avatars linked to their Jira profiles, and a Total Time From Create Issue column holding each issue's full working age.
The arithmetic decides what the numbers mean. The first interval runs from creation to the first assignee change. Every later one runs from one change to the next, booked to whoever held it across that gap. The whole timeline is cut into intervals with no overlap and no gaps, and each one is counted against the work calendar rather than the wall clock.
Three details decide whether the result is trustworthy:
- Unassigned stretches. Time with nobody assigned is real time, and the report keeps it in its own Unassigned column rather than discarding it.
- Assignment without work. Someone can hold an issue that sits in a queue the whole time. Reading Assignee Time next to Time in Status separates held it from worked on it — the same interval appears in both, split two different ways.
- The interval that is still running. The last assignee change has no change after it to close against, so its interval runs up to the moment the report runs, and it is not cut at resolution. A ticket closed in March keeps adding working hours to whoever held it last every day you re-run the report, and Total Time From Create Issue grows with it. Read the number as of a run, and compare two runs only if they were taken at the same moment.
When you need the individual hand-offs rather than the per-person totals, they are in Time in Changes: pick the assignee field in History by Fields and every change shows who made it, when, and how long the previous assignee held the issue. Who reassigned what, and when, is a separate question, answered there issue by issue.
How to build a workload per assignee report in Jira, step by step
- Open Time And History from the Jira top navigation and pick Assignee Time in the report list.
- Choose the Project, then narrow with Epic, Sprint, Reporter or Assignee — all multi-select, an empty one meaning "Any". Changing the project clears the Epic and Sprint selections; Reporter and Assignee stay as you set them, so clear them yourself when you switch to a project with a different team. All five reports share the same filters and date range.
- Set the Period — a preset such as Last 30 Days, or a custom range — and pick which date it applies to: Created, Updated or Resolved. Created over the sprint dates is the honest cut for a retrospective; Resolved silently drops everything still open.
- Pick the work calendar and the time format. The calendar decides what counts as an hour. The format only decides how that hour is printed, and never undoes it — including the two day-based formats, where a "day" means 24 counted working hours, not one business day.
- Read the table, which is the next section. Pages hold 15 issues. If the Assignee field column shows the wrong person, hover that cell and click the pencil to open Edit issue; the report reloads after saving.
- Export it.
XLSXandCSVexports run against the whole filter, not the 15 rows in front of you, and land in Export history when they finish. Those two formats are offered on all five reports, and aPNGof the open chart is offered on any of them while chart mode is open, Assignee Time included. The export walkthrough covers the mechanics and exporting the full list of formats. - Do nothing after that. There is no rule to keep running, no custom field to protect and nothing to hand over when you go on leave. The report is read out of history Jira already stored, so the sprint that closed last quarter is on screen the first time you open it — the setup is the two minutes above, and then nothing.
What one row tells you that a board grouped by assignee cannot
The report page is a matrix: one row per issue, one column per assignee who ever held it, an Unassigned column, and Total Time From Create Issue carrying that issue's full working age. Because unassigned time is kept rather than dropped, the assignee columns plus Unassigned reconcile against the total — add a row across and it comes out, which is the check to run before anyone quotes a column.
Take PROJ-318, on a Monday-to-Friday calendar with working hours from 09:00 to 17:00.
- Tuesday 3 March, 09:00 — created, and assigned to the triager who filed it
- Thursday 5 March, 17:00 — triaged and dropped back to unassigned
- Tuesday 10 March, 12:00 — picked up by a developer
- Tuesday 10 March, 15:30 — the report is run
| Key | Triager | Unassigned | Developer | Total Time From Create Issue |
|---|---|---|---|---|
| PROJ-318 | 24h 0m | 19h 0m | 3h 30m | 46h 30m |
Every native workload view in Jira shows this as one issue on the developer's plate. The report shows the developer held it for three and a half hours out of forty-six and a half, the triager for twenty-four, and nobody at all for nineteen. Read a column down instead of a row across and you have one person's share of the whole filter.
Two scopes sit on this page, and the page says which. The tiles above the table are captioned This page: Total time in statuses, Issues tracked, Assignees and Avg time per issue, over the rows in front of you — fifteen to a page — so you can recompute them from the screen. Switch to a chart and the same four tiles recompute over the Whole selection, with the caption changing to say so. Quote either; quote neither without its caption. What the mean hides in a Jira average works through why that scope is the part people forget.
One thing the report page deliberately does not have is a per-status axis; that split lives in the Time in Status report, and per person it lives in the Assignee Time (Table) gadget two sections down. Nor does this table carry an Avg, Median, Min and Max footer the way Time in Status does — the KPI tiles are the summary here, so there is nothing under the last row to go looking for.
Three checks to run on any workload report
Every status-time app on the Marketplace will hand you hours per assignee. The hours are not the product; the ability to put them in front of the person they describe is. Open a candidate and check:
- Do the columns add up? Read one row across. The assignee columns plus Unassigned should reconcile with that issue's Total Time From Create Issue. If they do not, time is being dropped somewhere and you will not be told where.
- Where did the unassigned time go? A report that quietly discards the stretches with nobody assigned reads as though the work sat with a person the whole time — and that is the number that gets quoted at a person.
- Whose clock is it on? A ticket handed off at 16:40 on Friday and picked up at 09:20 on Monday sat 64 hours and 40 minutes on the wall clock, and 40 minutes on a Monday-to-Friday, 09:00–17:00 calendar. Ask which one produced the figure, and whether the same calendar drives every other report you compare it against.
The same hours as a picture, over the whole selection
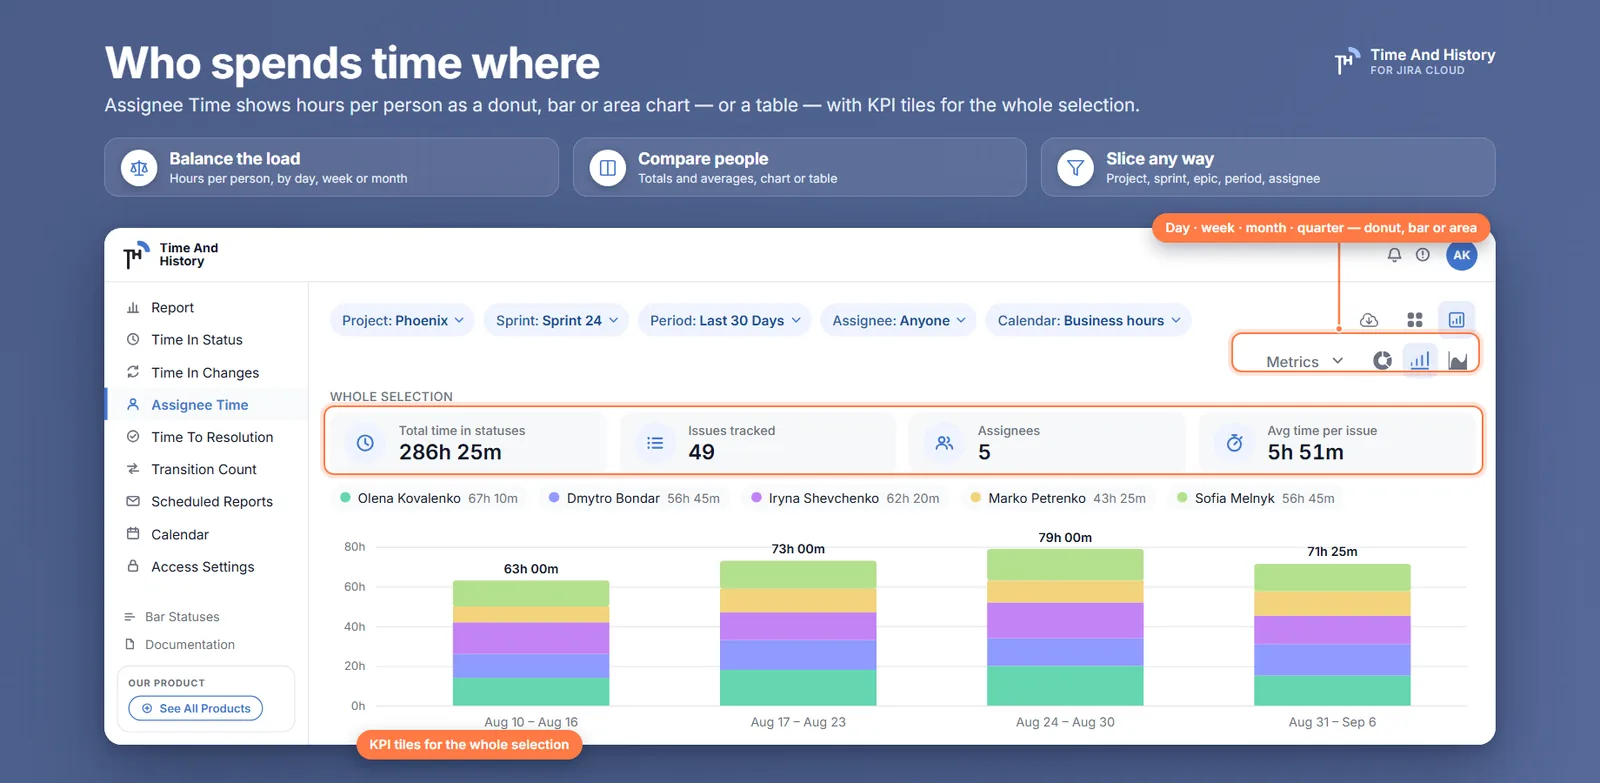
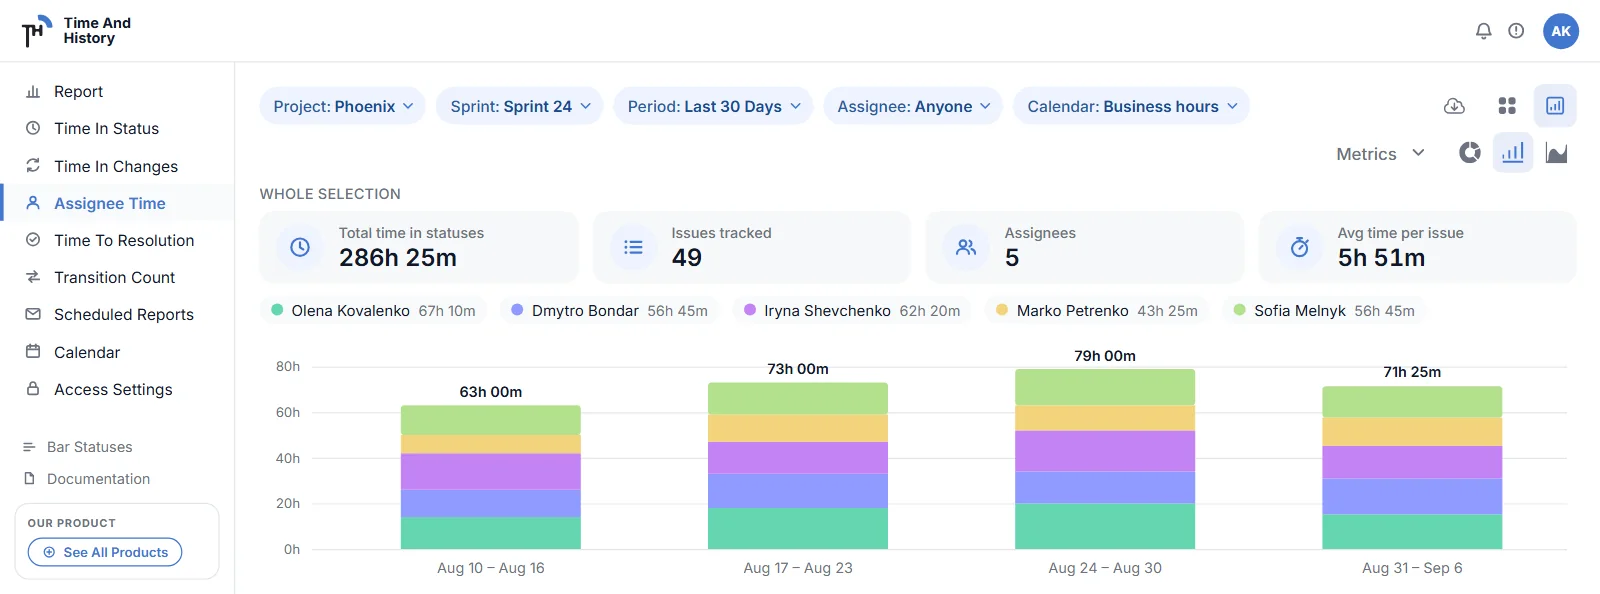
The table answers per issue, one page at a time. When the answer has to go on a slide instead of into a spreadsheet, the chart-mode switch beside the Export button draws the same hours as a picture — and changes which issues the numbers cover.
- A donut gives you share of time per person across the filter: the shape of who is carrying this.
- Bar and area put that on a time axis — hours per assignee per day, week, month, quarter or year, or Auto, which picks the grouping from your range. The period picker is hidden on the donut, which has no time axis to group by.
The four tiles stay above the chart and recompute over the Whole selection — every issue the filter matches rather than one page of fifteen — and the caption changes from This page to say so. It is the only place in the report where an Assignee Time number covers the whole filter on screen. The rules are the same on all five reports: charts and KPI tiles has them in full.
Put the per-person view where the team already looks
The report page answers per issue; a standup wants per person. Every report goes on a Jira dashboard as a chart gadget and a table gadget. The Assignee Time (Table) gadget is the per-person view. Four KPI tiles — total time, issues tracked, assignees, average time per issue — sit above a table with one row per assignee, each row expanding into per-status rows, and a Total row at the foot.
It is not the report page pivoted, and the difference is worth knowing before someone spots it. The gadget aggregates every issue the filters match rather than the page you were reading, so its Total row and the report page's This page tiles are meant to differ. And it adds the per-status breakdown the report table has not: who held the issue, and in which status it sat while they held it.
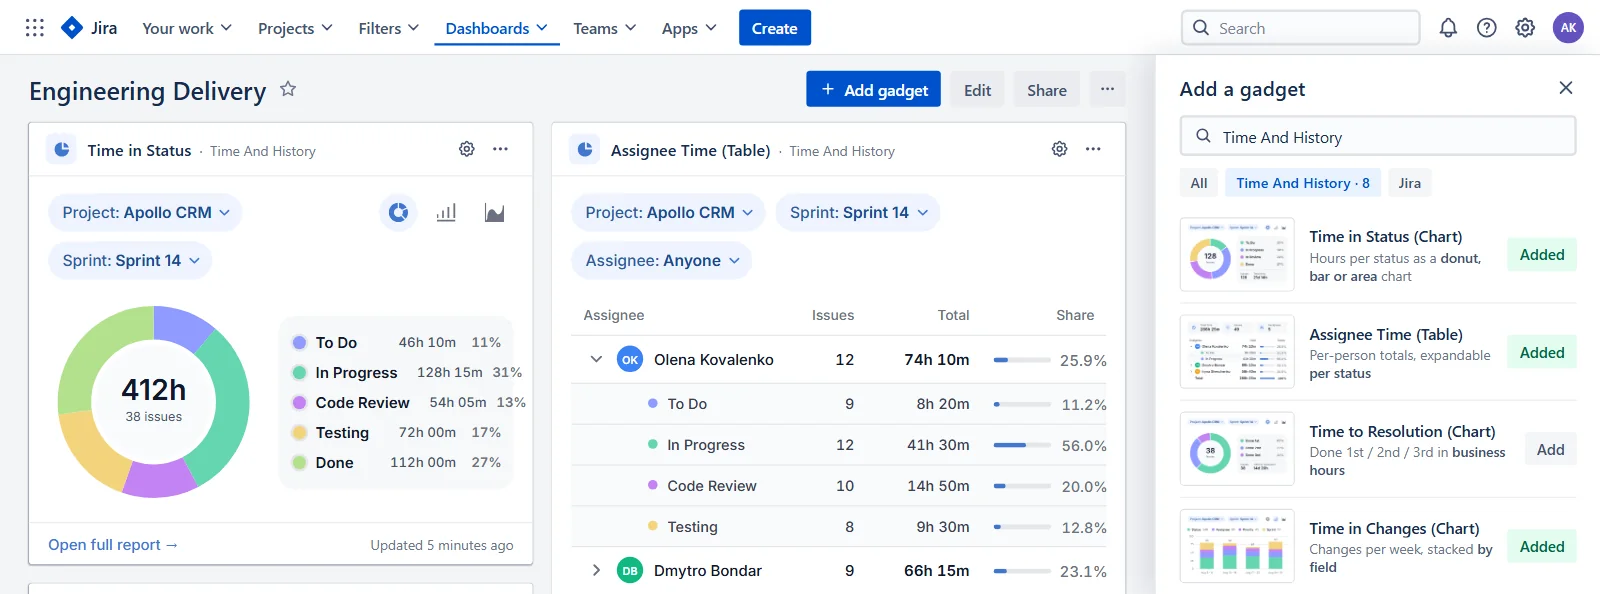
Two rules govern who changes what. Chips on the card re-cut a gadget for the person reading it and nobody else; the gear holds what everyone sees, and only dashboard editors can save it. Open full report carries the filters through when the answer needs the per-issue matrix. The full split is in why a gadget answers for everyone who did not run the report, and the field list in the dashboard gadget documentation.
What a hand-off costs, and where it shows up
Hand-offs cost time you can count. On PROJ-318 above, the issue spent 24 hours with the triager and three and a half with the developer — and 19 hours with nobody, sitting between the two. That unassigned block is the hand-off, and on a 09:00–17:00 calendar it is more than two working days in which nothing happened to the issue at all. Sum the Unassigned column across the filter and you have the price of the queue, in hours, on the same clock as everything beside it. Long stretches in that column in the middle of a workflow point at a step everyone assumes someone else owns.
When the hand-off is a hand-back — resolved, reopened, resolved again — the cost does not surface here at all. It surfaces as a second resolution time in Jira time to resolution, or as the gap between first exit and last exit on a status pair column.
If your board has a queue that belongs to nobody — and it does — reading last sprint's Unassigned column takes about two minutes. Time And History is free for up to 10 users.
Both effects are sensitive to the work calendar — the Friday hand-off above is 64 hours of queue or 40 minutes of it, depending on nothing but which clock produced the figure. A calendar also carries one time zone, so a team spread across two of them is measured against whichever one the calendar names. Agree on it before you compare people; business hours in Jira reports is the shorter version of that argument.
Part-time weeks and holidays belong in that calendar too — business days, per-weekday hours, a time zone, holidays set to repeat every year — so a colleague on leave stops reading as a bottleneck. One limit is worth knowing before you set one up: a calendar applies to the whole report, not to a person in it. You can keep a support calendar and an engineering calendar and switch between them; you cannot give one teammate a four-day week inside a report covering the team. The choice is yours alone. Pick a calendar and Time And History remembers it across sessions, on every report and gadget you open, and changes nothing for anyone else.
Present Assignee Time beside the status split, not on its own. Give the Unassigned column the same prominence as the named ones. Someone can be reviewing, pairing or on call without ever holding the issue, and none of that is in here.
The permission model does not change for this report. Everyone sees only the projects and issues they can already open in Jira, and which groups can open the reports at all is set on the Access Settings page.
What Jira gives you without an app
Jira is not short of workload views — its own report catalogue lists three, and the History tab on any issue holds the raw assignee changes, in calendar time, one issue at a time, with no export. Each answers a real question; none answers this one. The two escape hatches are the same ones that apply to every duration question in Jira — the REST changelog, and Atlassian Analytics on a Cloud Enterprise plan — and the Time in Status guide sizes both up. Native behaviour verified 2026-09-03.
| Option | Answers well | Where it stops |
|---|---|---|
| Assignee filter, or a board grouped by assignee | Who holds each issue right now, in any search, board or saved filter | The current value only. The field keeps no earlier holder — they survive in the changelog, never in the filter — and the result is a list of issues with no duration in it |
| User Workload Report, Workload Pie Chart, Version Workload Report | How much is on each person's plate today, as planned: unresolved issues currently assigned and their remaining estimate | Estimate-based by design, not history-based — planned load today, never elapsed time. No estimates gives an empty workload report; resolved work never appears; earlier assignees are invisible |
JQL's history operators (assignee WAS, assignee CHANGED) | Which issues a person ever held, or handed over inside a window: WAS and CHANGED both take AFTER, BEFORE, BY, DURING and ON, and CHANGED adds FROM/TO | Every query returns a set of issues, never a number. The predicates narrow which changes count; they never subtract two of them |
| Jira Automation stamping a field on each assignee change | The only place in stock Jira where a duration is computed and stored as data, in an ordinary filterable field | It cannot see the past — only hand-offs after the rule is enabled — so the field is empty for every issue you already care about, and it stays a field somebody maintains through every workflow change. Automation's date smart values have no businessHours unit either, so what it stores is wall-clock time with the weekends in it |
| The changelog endpoint | Every assignee change ever recorded, including on work closed years ago | You own the arithmetic, the pagination and the business-hours logic, and you pay a request per issue. A script run, not a report |
The difference that decides it is rarely accuracy. A stamping rule starts counting the day someone builds it, so the answer about last quarter arrives next quarter — and from then on somebody owns the rule, the field, and an edit every time the workflow changes. Assignee Time is read out of the changelog, so last quarter is on screen this afternoon and nobody owns anything afterwards.
Workload per assignee in Jira FAQ
How do I see workload per assignee in Jira?
The ready-made native views only show who holds each issue today — an assignee filter, a board grouped by assignee, or the User Workload report and Workload Pie Chart, which count remaining estimates on unresolved issues currently assigned. Earlier holders survive only in the changelog: assignee WAS returns them as a list of issues with no durations, and turning them into numbers means the REST API or, on Cloud Enterprise, Atlassian Analytics. For time actually held, the Assignee Time report pairs each assignee change in the issue history with the next and books the interval to whoever held it, in business hours.
Can Jira show how long each developer worked on a ticket?
No native report does it for you. Jira records every assignee change with a timestamp but never the interval between two of them, so short of the REST API changelog — or Atlassian Analytics on Cloud Enterprise — nothing native puts a duration next to a person. The Assignee Time report does: read one row across its assignee columns. But that is time held, not effort spent, which is why you read it beside a Time in Status report.
How do I see the previous assignee in Jira?
The Assignee field holds only the current one, and nothing in Jira search will return an earlier holder as a value — assignee WAS returns the issues a person once held, never the person. Every previous assignee is in the issue history, one issue at a time, under History on the issue. To read them across a filter instead, pick the assignee field in History by Fields on Time in Changes: every change shows who made it, when, and how long the previous assignee held the issue.
Why is the Jira Workload report empty or misleading?
Because it reads remaining time estimates on unresolved issues currently assigned: a team that does not estimate gets an empty report, and a team that does gets planned load rather than elapsed time. Closed work never appears and every earlier assignee is invisible.
How is time counted when a Jira issue is reassigned or left unassigned?
Each interval is booked to whoever held the issue during it, so a ticket that passed through three people fills three columns rather than one. Stretches with nobody assigned land in their own Unassigned column instead of being discarded, which is why the assignee columns plus Unassigned reconcile with Total Time From Create Issue.
Can I put workload per assignee on a Jira dashboard?
Yes — the Assignee Time (Table) gadget puts KPI tiles that include the average time per issue above one row per person, each expandable into per-status rows, with a Total row at the foot. It aggregates every issue the filters match, so its numbers cover more than one page of the report. Chips on the card re-cut it for your session only and are lost on reload; saving in the gear needs edit rights on the dashboard.
What does a workload per assignee report cost?
Time And History is free for Jira Cloud sites with up to 10 users — the Assignee Time report, its dashboard gadget and the exports included, with no separate tier for them. Larger sites are on the paid plan, which starts with a free trial from the Marketplace listing, and the report behaves identically on both. Checked 6 September 2026 — the listing has the current terms.
See where the workload actually landed
Run Assignee Time on the sprint that just closed, with the period on Created, and read the Unassigned column before anybody's name. If it is the widest one, the conversation is about the workflow rather than about people — the more useful conversation, and the harder one to start without a number. Then switch to a chart and watch the tiles change from This page to Whole selection: the same reading over every issue the filter matches, which is the version that survives being questioned.
Assignee Time is one of the five reports in Time And History for Jira Cloud. Time in Status, Assignee Time, Time to Resolution and Time in Changes are each counted in business hours; Transition Count, the fifth, counts status changes rather than hours. All five are available as dashboard gadgets. Install it from the Atlassian Marketplace and run Assignee Time on the sprint that just closed — free for up to 10 users, so one team lead can check last sprint without raising a purchase order. The Assignee Time documentation has the rest of the rules. Verified 6 September 2026; gadget coverage updated 26 September 2026.